Figure 6.
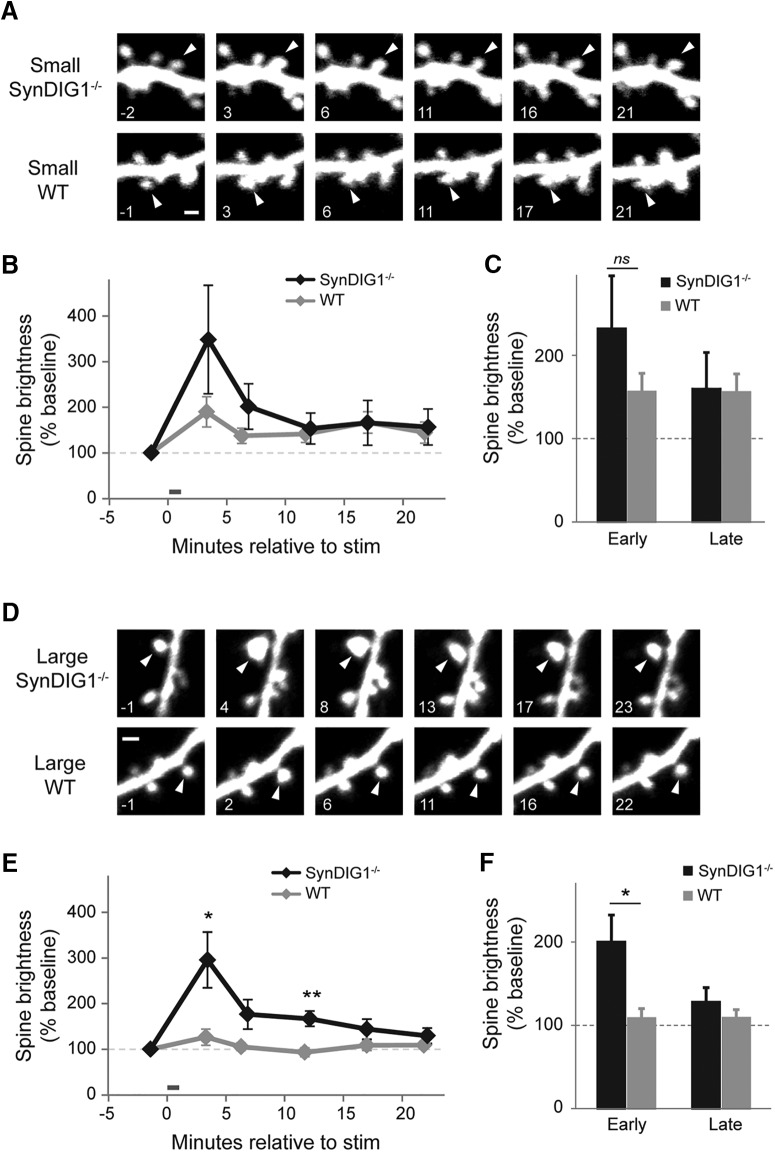
SynDIG1 limits early-phase structural plasticity in large spines. A, Representative images illustrating small stimulated spines (arrowheads) on EGFP-expressing neurons from SynDIG1 β-gal homozygous mutant neurons (top) and neurons from WT mice (bottom). Time stamps are in minutes relative to LTP stimulation. Small spines are defined as <85% of average neighbor brightness. Scale bar, 1 µm. B, Time course of small spine structural plasticity. There are no significance differences between genotypes (WT, n = 14 stimulated target spines on 14 cells; SynDIG1 β-gal homozygous mutant, n = 13 stimulated target spines on 13 cells; p > 0.2 for all comparisons). Error bars indicate ±SEM. C, The average early (<15 min after stimulation) and late (>15 min after stimulation) change in small spine brightness by genotype. There are no significant differences between genotypes (p > 0.4 for all comparisons). Error bars represent ±SEM. D, Representative images illustrating large stimulated target spines (arrowheads) on EGFP-expressing neurons from SynDIG1 β-gal homozygous mutant neurons (top) and WT neurons (bottom). Time stamps are in minutes relative to LTP stimulation. Large spines are defined as >85% of average neighbor brightness. Scale bar, 1 µm. E, Time course of large spine structural plasticity. Large stimulated spines on WT neurons did not enlarge after stimulation (black line; n = 8 spines on 8 cells). Large stimulated spines on SynDIG1 β-gal homozygous mutant neurons enlarged significantly 3 and 12 min after stimulation (gray line; n = 7 spines on 7 cells; p < 0.05). Error bars represent the SEM. F, The average early (<15 min after stimulation) and late (>15 min after stimulation) change in large spine brightness by genotype. Large stimulated spines on SynDIG1 β-gal homozygous mutant neurons enlarged significantly more than those of WT neurons during early-phase, but not late-phase, structural plasticity (p < 0.05). Error bars represent ±SEM.

