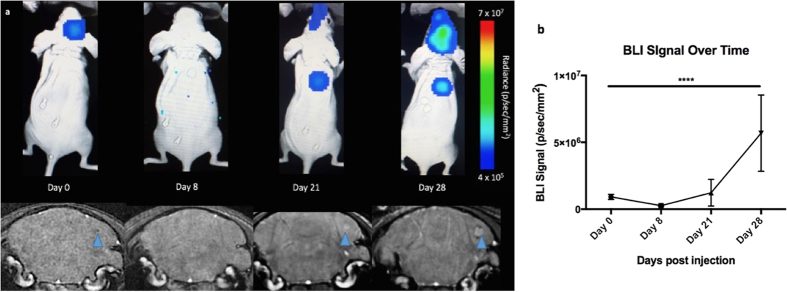
Figure 4.
MRI and BLI over time (a) Representative BLI (top) and MRI images (bottom) of one mouse imaged on days 0, 8, 21 and 28; blue arrow shows signal void progressing into tumour (b) BLI signal in the brain over time. This graph is representative of 8 mice that made it to endpoint. A one-way ANOVA was performed and all time points were found to be significantly different (p < 0.0001).

