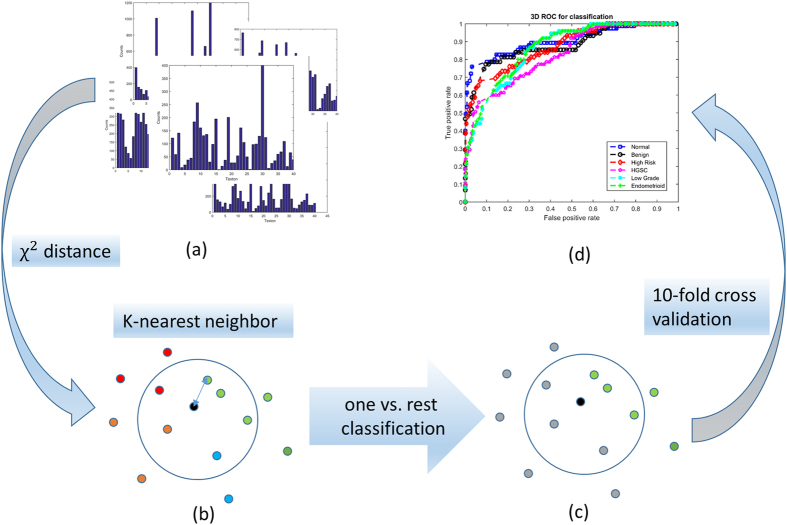
Figure 3.
Classification stage flowchart showing (a) representative training image models; (b) demonstration of the χ2 nearest neighbor (NN) classification with four different classes (circle in four different colors); (c) demonstration of one vs. rest classification, where the black circle represent a models of the test image stacks, the green circles represent training models of one of the tissue classes, and the grey circles represent models of the remainder of the classes. (d) Resulting ROC curve.

