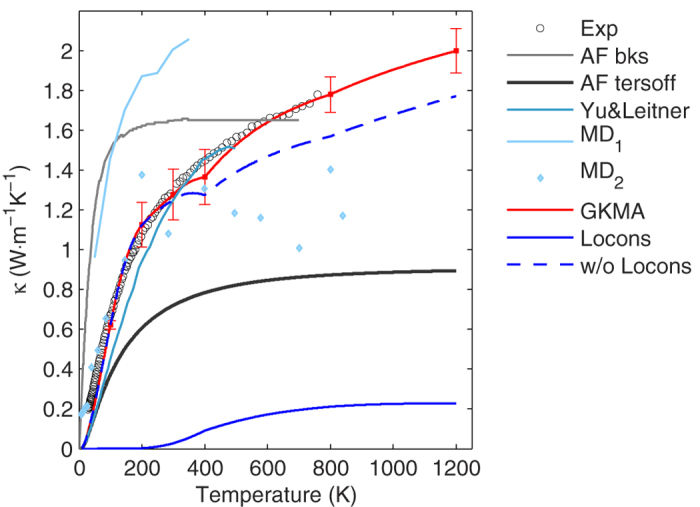
Figure 3. Thermal conductivity vs. temperature as compared to other models and experiments.

The red curve is the temperature dependent TC of a-SiO2 from GKMA calculations with error bars showing the standard deviation between independent simulations, experimental results (black circles) is from ref. 27, AF bks is Allen-Feldman theory prediction from reference27 using Beest-Kramer–van Santen (BKS) potential38,39, AF tersoff is A-F theory prediction using Tersoff potential, the Yu & Leitner results were obtained from ref. 40, where they used the wave-packet method to calculate the mode diffusivity under the harmonic approximation, MD1 is a non-equilibrium molecular dynamics simulation result from Shenogin et al.27, MD2 is the MD result with quantum corrections from Jund and Jullien41, the solid blue curve represents the locon contribution to the TC and the dashed blue curve is the sum of all other delocalized mode contributions.
