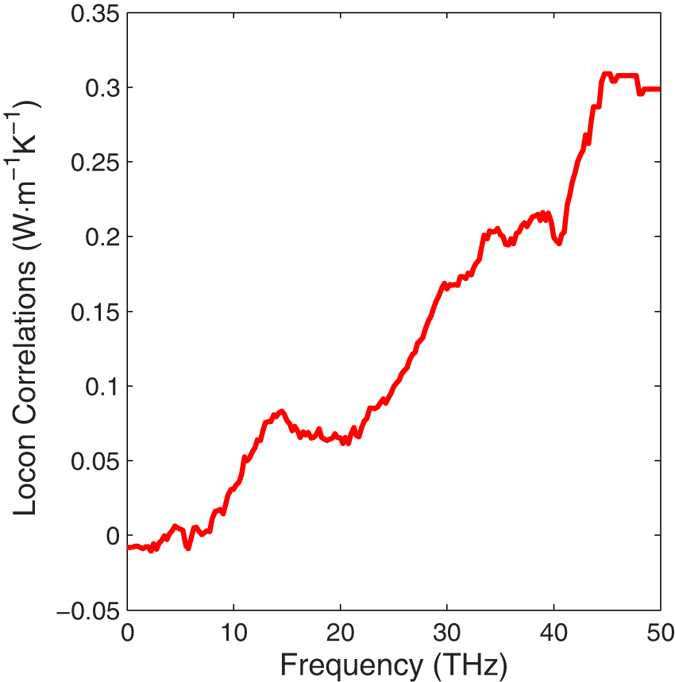
Figure 4. Locon correlations with different frequency modes.

The locons-locons correlations contribute around 45% and the diffusons-locons correlations contribute the other 55%. The propagon-locons correlations contribute negligible. Here, each group’s correlation is computed by simply summing the associated values of auto and cross correlations multiplied by the pre-factor in Eq. 2 that yields the units of thermal conductivity. These thermal conductivity contribution values are then shown here, vs. the mode frequency for the modes the locons are correlated with.
