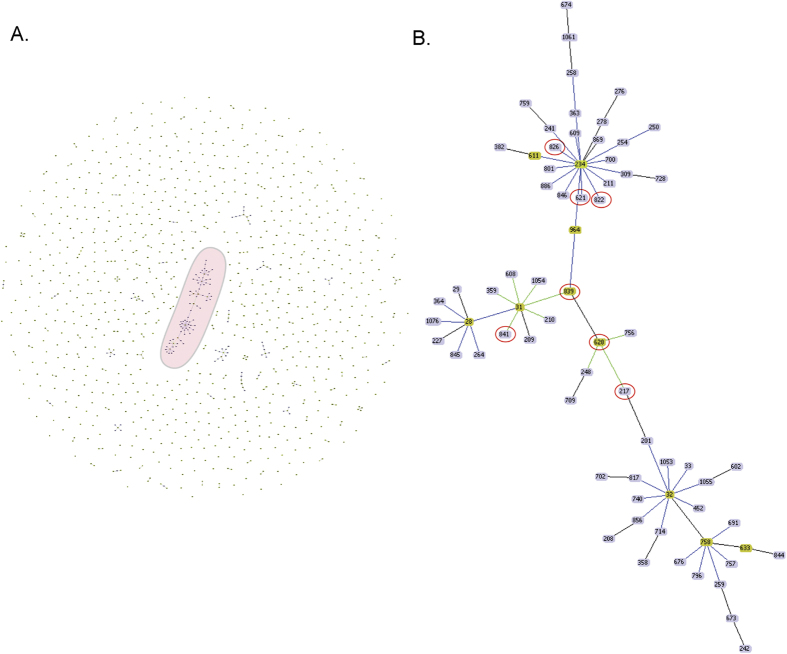
Figure 3. Populations structure analysis.
(A) goeBURST analysis of the 1083 STs present in the PubMLST database. Each dot represents the single ST. Groups are formed by linking the STs that are double locus variants (DLV) and called as clonal complex (CC). The largest clonal complex 31 is highlighted in the pink eclipse. Light green - Group founder; Dark Green-Sub-group founder; Light blue - Common node. (B) Snapshot of the clonal complex 31 which is highlighted as a pink circle (in A). The STs which are marked as red colour circles are from this study which is linked to clonal complex 31.

