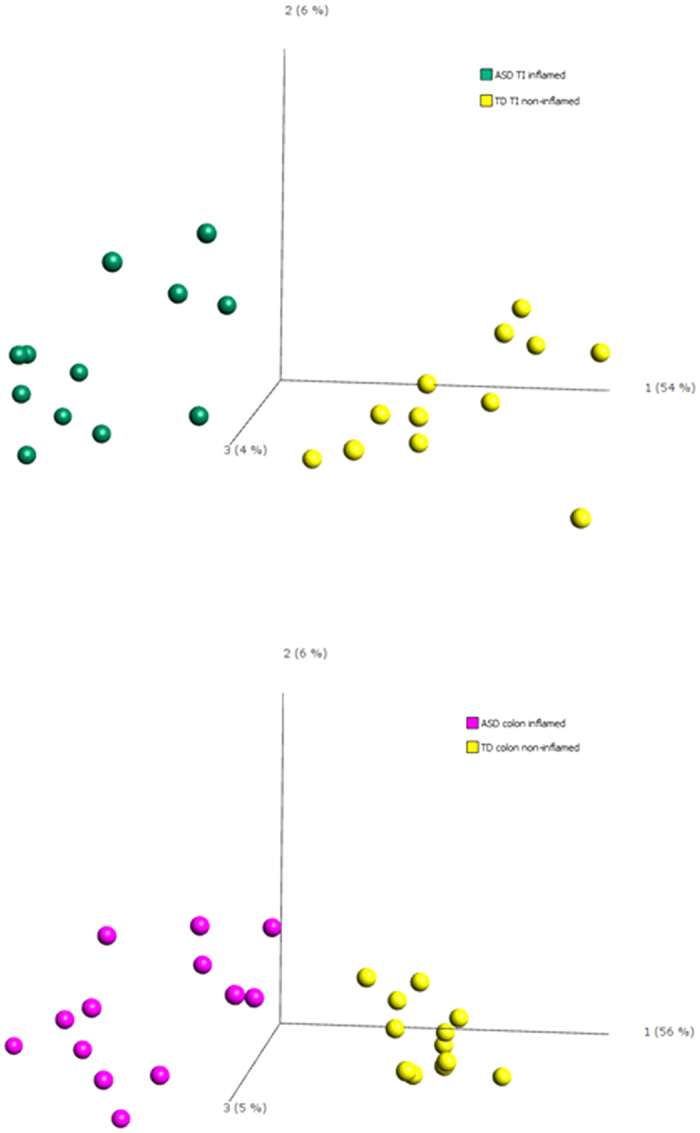
Figure 1. Principal component analysis.

Gene expression profiles of inflamed terminal ileum tissue from ASD patients, compared to non-inflamed tissue from controls (top panel) and corresponding profiles in colonic tissue (bottom panel); p = 0.001. Teal = ASD-TI inflamed; Yellow = TD-TI non-inflamed; Violet = ASD colon inflamed; Yellow = TD colon non-inflamed.
