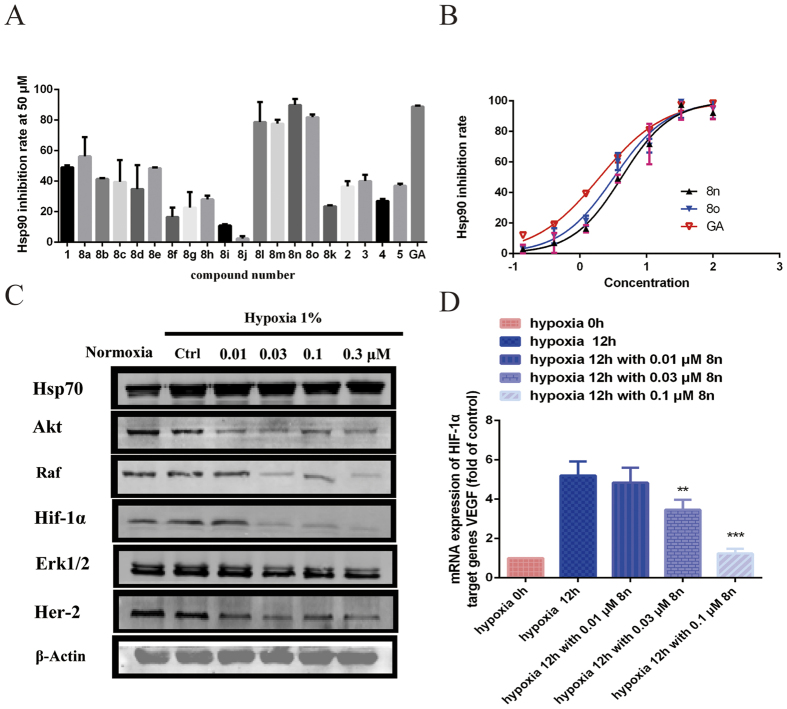
Figure 9.
(A) The caged compounds (50 μM) inhibited the Hsp90 ATPase activity in a HTRF-based inhibition assay. (B) The IC50 values for the inhibition of Hsp90 ATPase by 8n, 8o and GA as detected by the HTRF Transcreener ADP kit. The test compounds were diluted to obtain a range of concentrations and incubated with Hsp90 and ATP. The amount of ADP generated was detected. (C) Western blots of the Hsp90 client proteins after HepG2 cells were treated with the indicated concentrations of 8n for 24 h. (D) The mRNA expression of VEGF was determined by real-time quantitative reverse-transcriptase polymerase chain reaction (RT-PCR) and analysed by the delta Ct method. The bars represent the means with standard error of the mean (SEM) and the fold change in the VEGF/GAPDH ratio relative to the vehicle-treated group. The different significance levels are indicated as **P < 0.05.

