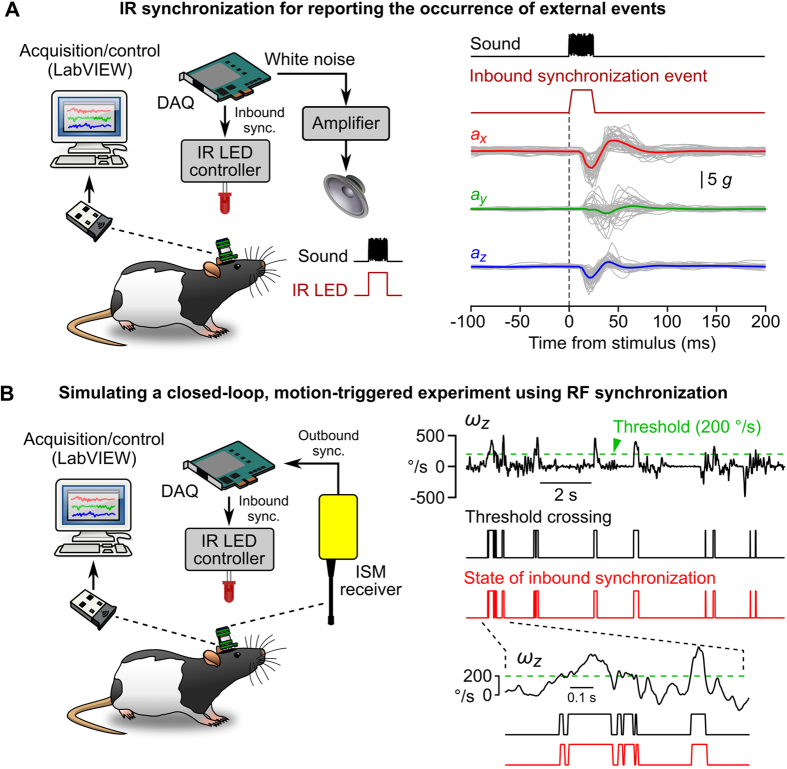
Figure 3. Bidirectional synchronization using two separate wireless channels.
(A) Left: schematic of the acoustic startle experiment. Bursts of white noise (25 ms) were generated by a DAQ and played by a loudspeaker. At the onset of each stimulus, a synchronous 5 V signal was used to gate the emission of an IR synchronization signal. Right: startle responses recorded in one animal. Linear acceleration along the 3 axis (ax, ay and az) was aligned on the onset of the IR event and averaged. Superimposed gray lines represent individual sweeps and color lines represent average linear accelerations. (B) Left: schematic of the closed-loop, motion-triggered experiment. The IMU was configured to emit RF power when yaw angular speed towards the left exceeded 200°/s. The output of the RF receiver was monitored through the digital input channel of a DAQ and conditioned the execution of an analog output task. The analog output was a simple 5 V command that was used to gate the emission of IR signals. Right: Yaw angular velocity (ωz) and outbound/inbound synchronization information recorded by the IMU during a 12 s period. The dashed green line represents the angular velocity threshold above which RF power was emitted by the IMU. The black and red lines below represent the states of the booleans reporting the detection of an angular velocity value exceeding threshold (Threshold crossing, black) and the presence of an IR signal (State of inbound synchronization, red).

