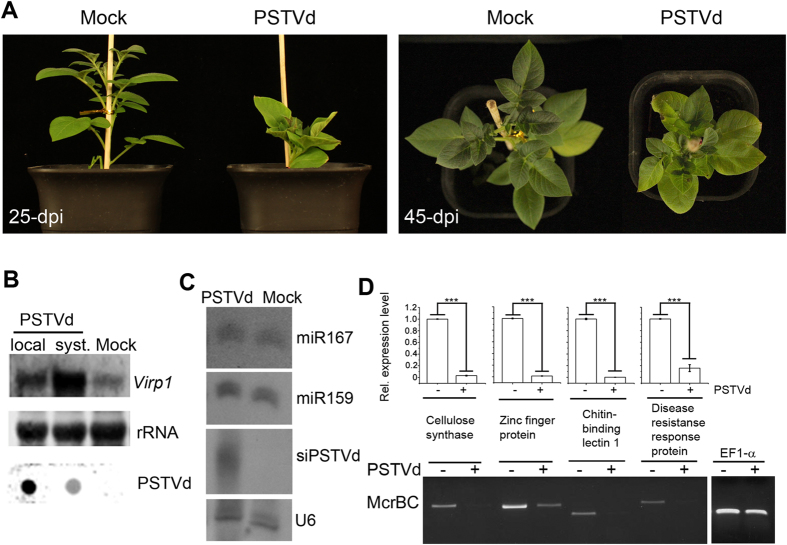
Figure 4. Effects of PSTVd infection on Virp1 expression and DNA methylation in host potato plants.
(A) Disease symptoms on potato plants inoculated with PSTVd at 25-dpi and 45-dpi. (B) RNA gel blot detection of Virp1 mRNA accumulation and Dot-blot hybridization detection of PSTVd accumulation in both inoculated and systemic leaves of the host potato plants. Methylene blue-stained ribosome rRNA was used as the loading control. (C) RNA gel blot analysis of endogenous small RNAs and siPSTVd in PSTVd-infected host potato plants. U6 hybridization was used as the loading control. (D) Quantitative RT-PCR analysis of the expression levels of the selected genes in PSTVd-infected host potato plants. Error bars represent SD for three replicates. Relative transcript levels were calculated by the ∆∆C(t) method (Livak and Schmittgen, 2001) using EF1-a transcripts (potato elongation factor 1−α) as the internal standard. The value of mRNA in plants (−) was arbitrarily designated as 1. The asterisks indicate significant differences (P < 0.05, one-way ANOVA). McrBC PCR analysis of the DNA methylation levels of selected gene promoter sequences in PSTVd-infected host potato plants.

