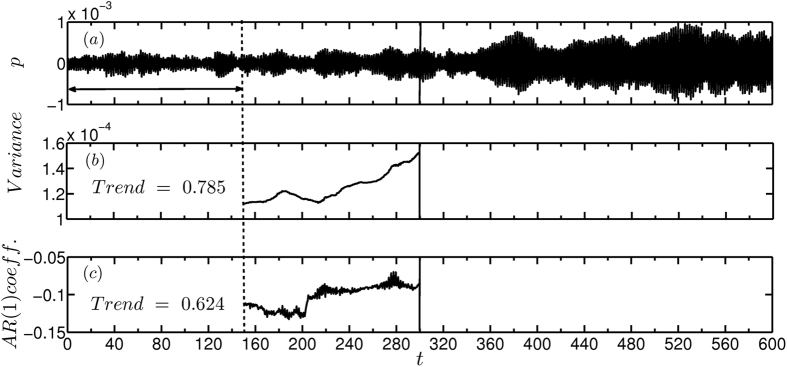
Figure 6. Early warning signals for subcritical Hopf bifurcation in the presence of high intensity additive noise using the time series generated from the model (equation (2)).
(a) Time series of unsteady pressure depicting the transition from a stable to an alternate stable state. The control parameter k is increased as a function of time, given by k = 1.667 × 10⁻³ t, from 0 to 1. Plot depicting the change in (b) variance and (c) lag-1 autocorrelation as the system approaches the critical transition. We observe a clear increase in variance and autocorrelation well before the transition. We maintained the value of ε such that the non-dimensional noise intensity is 0.2 to match the experimental conditions.

