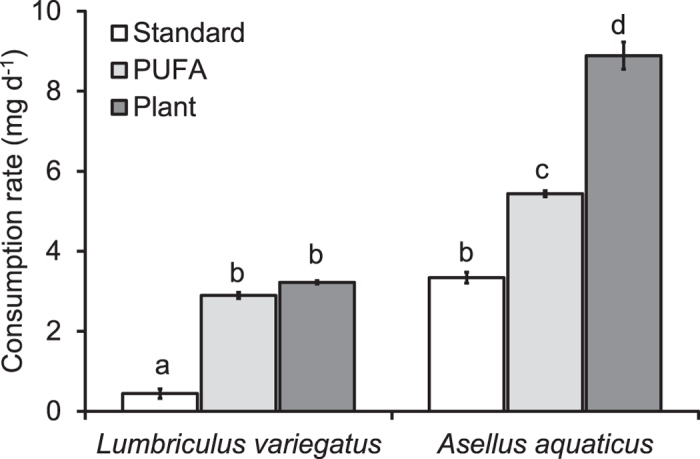
Figure 1. Average (±SE) consumption rates (mg d−1) of the three DECOTAB types by L. variegatus and A. aquaticus in microcosms over sixteen days (n = 5).

Letters indicate significant differences between consumption rates (ANOVA F5,24 = 305, P < 0.001, Post-hoc Tukey’s b test).
