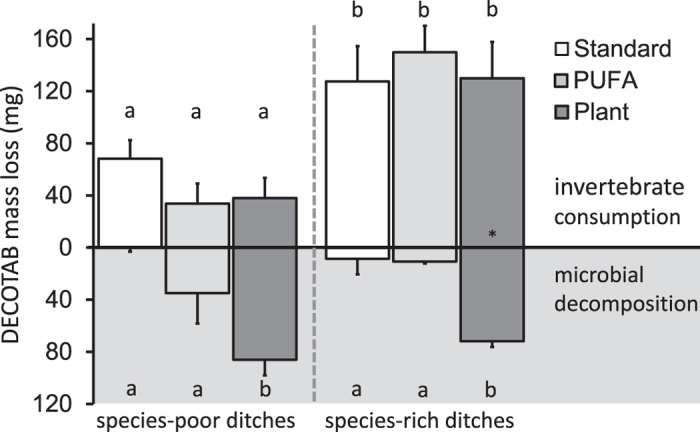
Figure 2. Loss of DECOTAB mass (mg) per cage after 43 days due to invertebrate consumption and microbial decomposition (note inverse scaling for latter) in species-poor and species-rich ditches (mean ± SE, consumption n = 9; decomposition n = 3).

Significant differences in DECOTAB loss between ditches due to invertebrate consumption (upper part) and decomposition (lower part) are indicated by letters. *n = 8.
