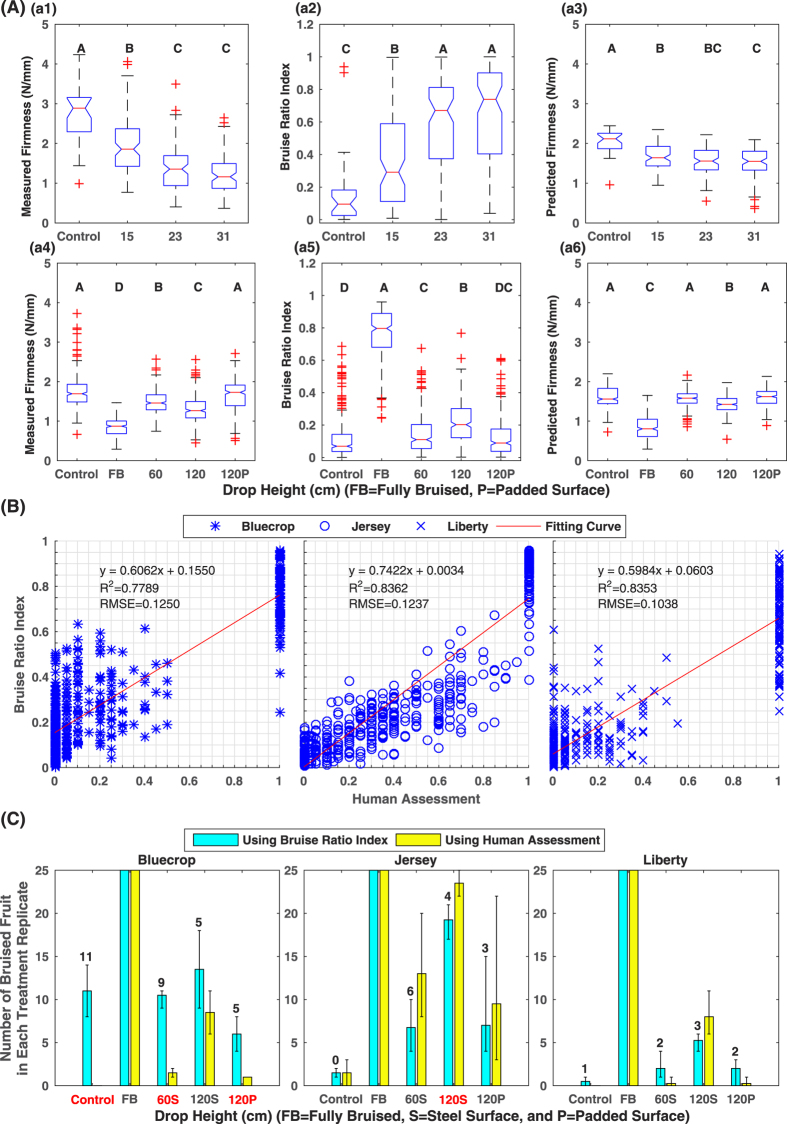
Figure 5. Statistical analysis results in the present study.
Panel (A): boxplot of measured firmness, bruise ratio index extracted from HSI, and predicted firmness by PLSR. Treatments with different letters are statistically significant with each other (see Supplementary Tables S4–S9), and treatment mean values of each index are sorted alphabetically. (a1–a3) and (a4–a6) are measured firmness, bruise ratio index, and predicted firmness for Dataset1 (southern cultivars) and Dataset2 (northern cultivars), respectively. Panel (B): linear regression between bruise ratio index and human assessment for three northern cultivars including Bluecrop, Jersey, and Liberty. Panel (C): Comparison between the number of bruised fruit calculated by bruise ratio index and human assessment using a threshold value of 0.2. The red color of the treatment name indicated the results calculated by the bruise ratio index were statistically different from that calculated by human assessment (see Supplementary Tables S10–S12).

