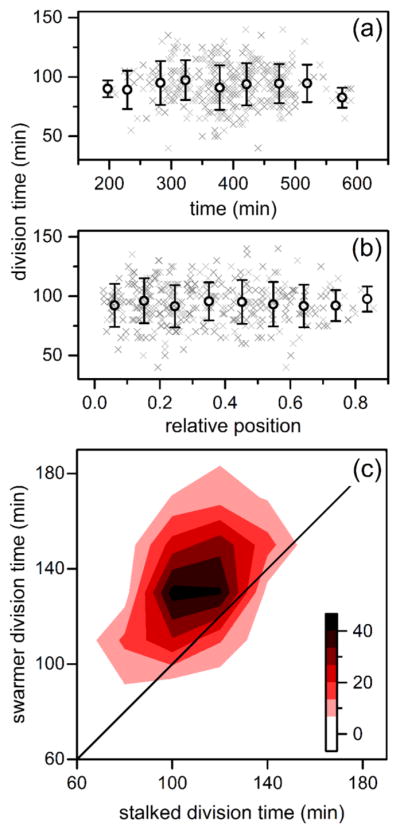
Figure 5.

Variation of division times of C. crescentus stalk cells in the nanochannels with (a) time and (b) relative position within the channel. The gray crosses represent 362 individual divisions, and the black circles are averages binned in 50 min intervals and 0.1 channel positions. Error bars are ± σ. (c) Heat map of division times of paired stalked cells and swarmer cells where division events increase from white to black. Upon division of a stalked cell, the resulting stalked and swarmer cell were tracked until subsequent division of each cell to determine its respective division time.
