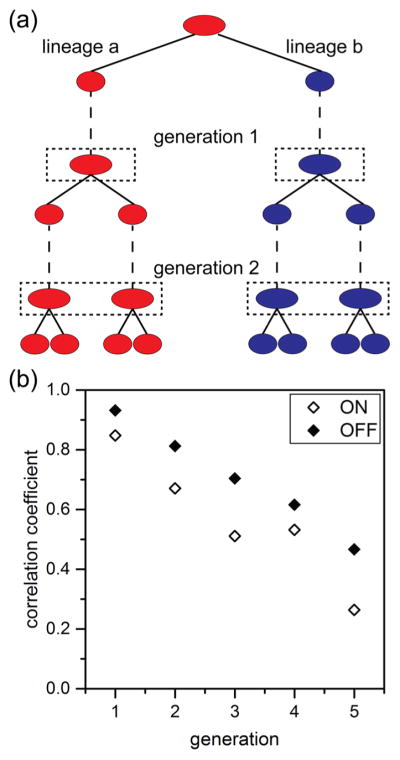
Figure 6.
Expression of the Phag-gfp construct shown in Figure 2b tracked over 8800 cell divisions across 5 generations. Lineages were initiated from the brightest 20% and dimmest 20% of cells from 22,000 total cell divisions. (a) Lineage pairs were identified from the two daughter cells from a single division event and were arbitrarily chosen to be lineage “a” (red) or lineage “b” (blue). Subsequent growth and divisions were tracked throughout the experiment, and fluorescence intensities were determined one frame prior to division for each lineage (dashed boxes). (b) Variation of correlation coeffcients with generation for lineages that were initially identified as expressing the Phag-gfp construct (ON) and those lineages that were not (OFF).

