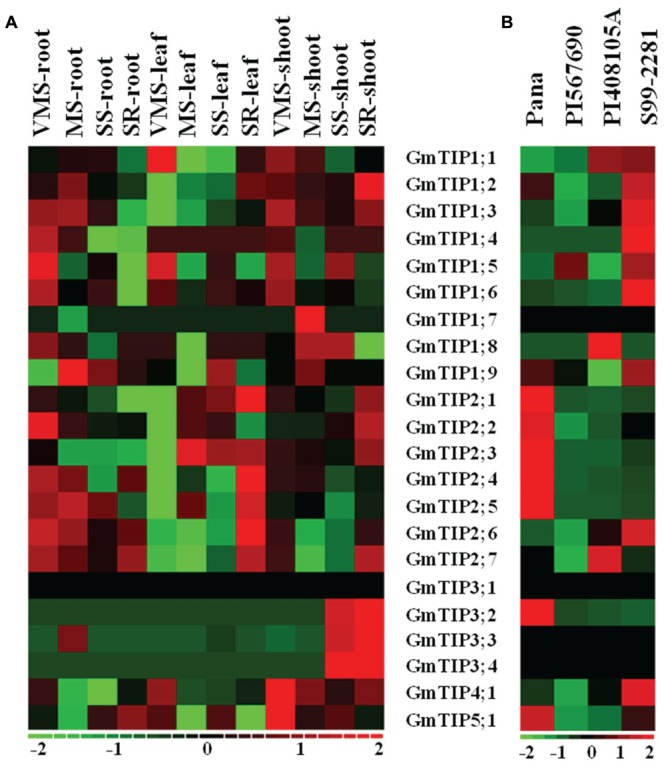
FIGURE 6.

Expression profiles of soybean TIP genes under different abiotic stress conditions or in different germplasms. (A) Heatmap representation of expression patterns of soybean TIP genes across the root, leaf, and shoot tissue in Williams 82 under varying water-deficit stress conditions (VMS: very mild stress; MS: mild stress; SS: severe stress; SR: water recovery after severe stress). (B) Expression profiles of the soybean TIP genes in leaves of Pana (fast wilting, drought vs. control), PI 567690 (slow wilting, drought vs. control), PI 408105A (flooding tolerant, flooding vs. control), S99-2281(flooding sensitive, flooding vs. control). The expression data values were median-centered and normalized for each gene before transforming to the color scale (log2-transformed ratios). The color bar at the bottom shows the range of expression values from increased expression (red) to decreased expression (green), 0 means no gene expression pattern changed (Black).
