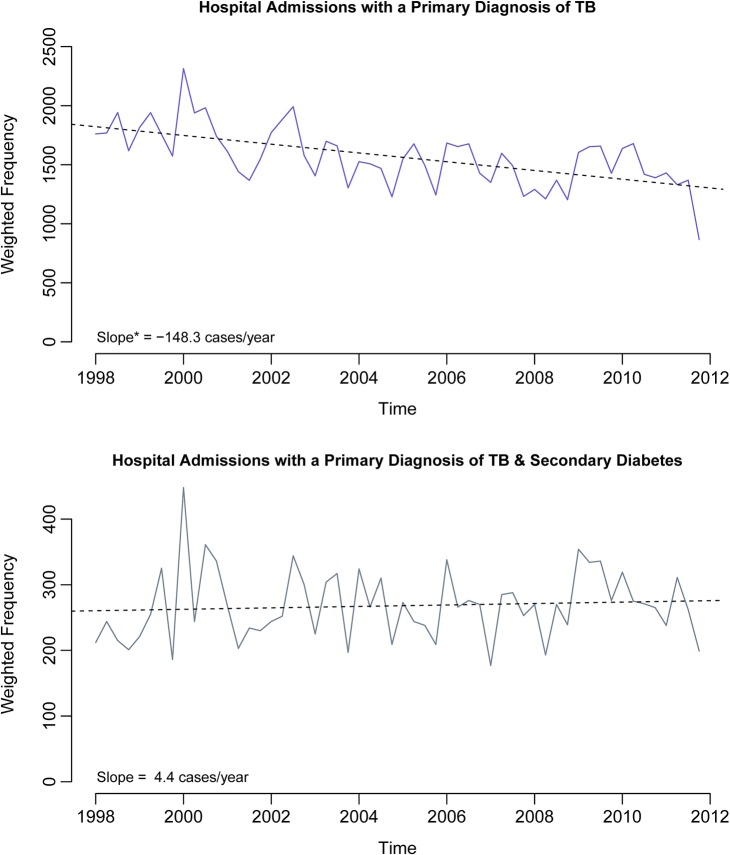
Figure 1.
Quarterly hospitalizations of patients diagnosed with primary TB (top) or primary TB and secondary diabetes (bottom) in the USA (NIS, 1998–2011). *Not adjusted for autocorrelation; adjusted slope is –153.2 cases/year (based on modeling the errors as an autoregressive process of order one). NIS, Nationwide Inpatient Sample; TB, tuberculosis.

