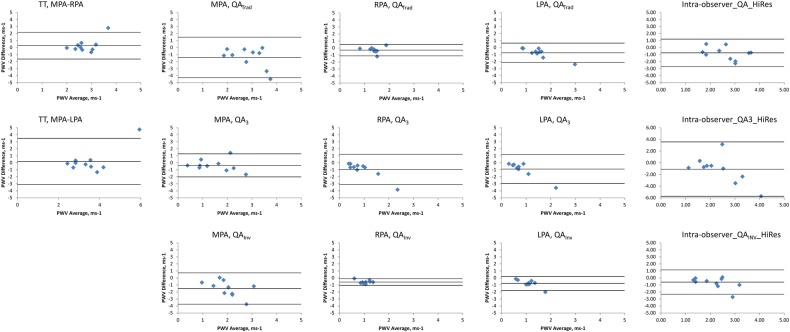
Figure 5.
Bland-Altman plots comparing intraobserver PWV repeatability. The middle line represents the mean difference while the upper and lower lines represent the±2SD limit. 3, three point technique; Inv, inverse squared reciprocal technique; LPA, left pulmonary artery; MPA, main pulmonary artery; PWV, pulse wave velocity; QA, flow area; RPA, right pulmonary artery; Trad, traditional technique; TT, transit time.

