
Fig. 2.
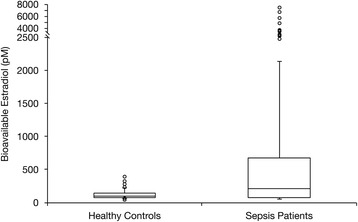
Bioavailable estradiol in sepsis patients versus control subjects. Box plot shows the medians with 25th and 75th percentiles. The circles represent outliers beyond the whiskers that designate the 10th and 90th percentiles
Official websites use .gov
A
.gov website belongs to an official
government organization in the United States.
Secure .gov websites use HTTPS
A lock (
) or https:// means you've safely
connected to the .gov website. Share sensitive
information only on official, secure websites.
Bioavailable estradiol in sepsis patients versus control subjects. Box plot shows the medians with 25th and 75th percentiles. The circles represent outliers beyond the whiskers that designate the 10th and 90th percentiles