
Fig. 2.
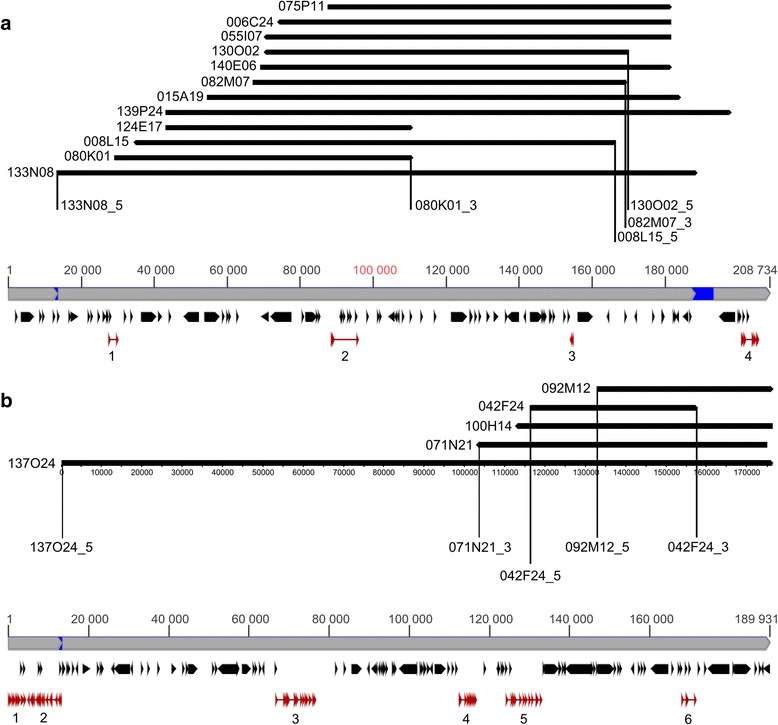
The structure and functional annotation of superscaffolds carrying LanFTc1 (a) and LanFTc2 (b) genes. Consensus superscaffold sequence is visualized by grey bar, whereas overlapping BAC clones by black bars. Vertical lines tag position of BES markers. Black objects represent repetitive elements whereas red ones mark non-repetitive coding sequences. Arrows indicate orientation in consensus sequence