
Fig. 3.
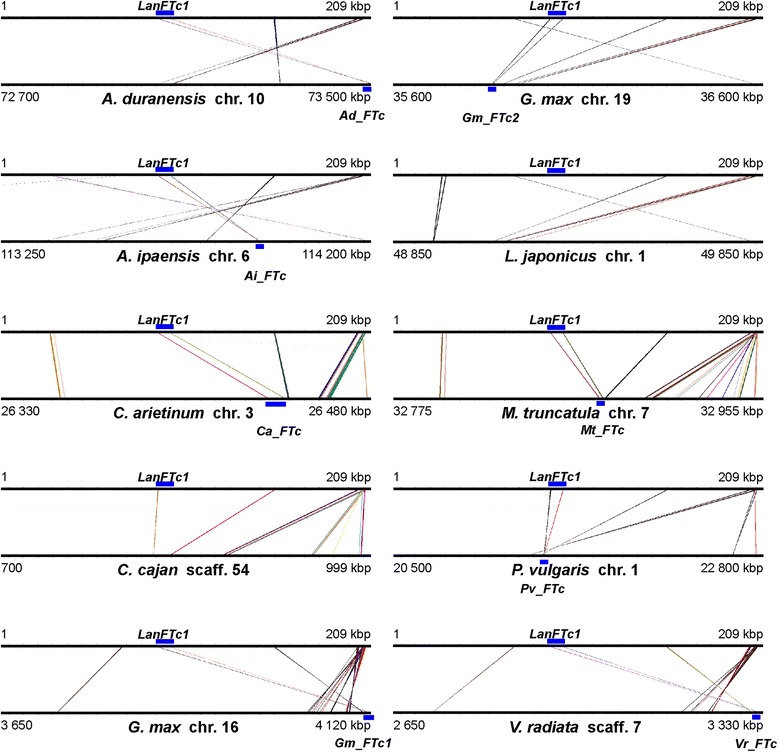
Synteny between superscaffold-1 and corresponding genome regions of nine legume species. Microsyntenic blocks are drawn as Genome Synteny Viewer diagrams. Each graph is composed of two horizontal lines; the upper presents the sequence of L. angustifolius superscaffold-1, while the lower line shows the corresponding region of a model legume genome. The scale of the bottom bars is variable, so the chromosome localizations are given. Blue blocks visualize the positions of FTc homologs