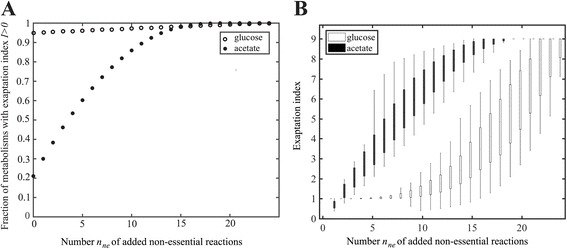
Fig. 2.

Exaptation potential and non-essential reactions. Vertical axes show (a) the fraction of metabolisms with exaptation index I>0, and (b) the exaptation index itself, among metabolisms generated by adding a given number n ne of non-essential reactions (x-axis) to the minimal metabolisms viable on glucose (open circles/boxes), and acetate (filled circles/boxes). Boxes span the 25-th to 75-th percentile, and whiskers indicate maxima and minima. Note that this analysis is exhaustive, meaning that (i) all minimal metabolisms viable on glucose (161), and acetate (76) are considered, and (ii) all possible n ne -tuples of non-essential reactions (x-axis) have been added to each minimal metabolism
