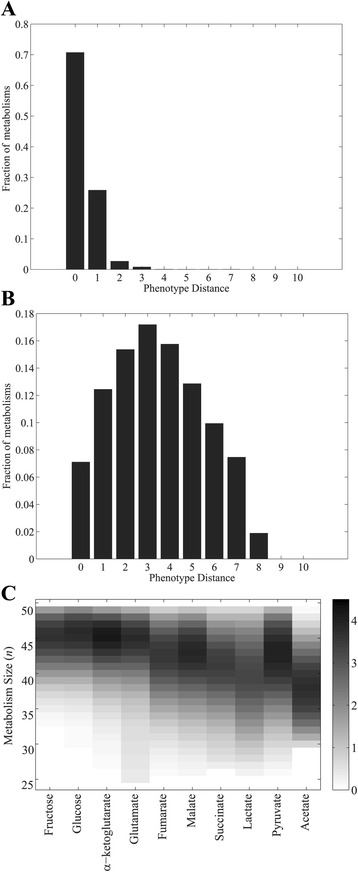
Fig. 3.

Metabolisms can preadapt to a wide variety of carbon sources. Panels a and b show histogram of the phenotype distance (x-axis), for metabolisms of size (a) 30, and (b) 45 viable on glucose as carbon source C. c Mean phenotypic distance (coded by shade of grey, see legend) of metabolisms viable on a focal carbon source (x-axis) and with a given number of reactions n (y-axis)
