
Fig. 1.
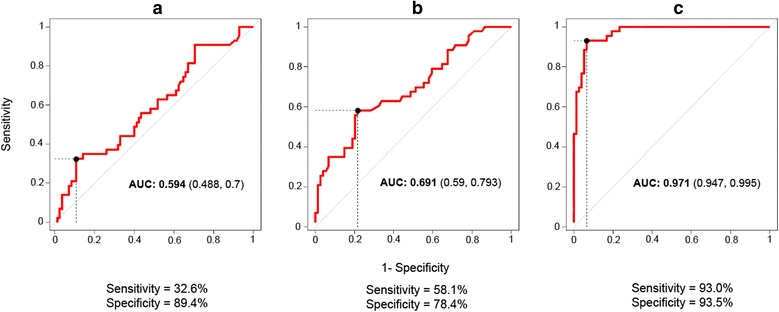
Receiver operating characteristic (ROC) curves for ELISA A (a), ELISA B (b) and ELISA C (c) for the detection of antibodies against Sarcoptes scabiei in Iberian ibex. The red line shows the mean area under the curve (AUC) plot, with the AUC value and the 95 % confidence intervals in parentheses. The sensitivity and specificity values correspond to the points in the plots