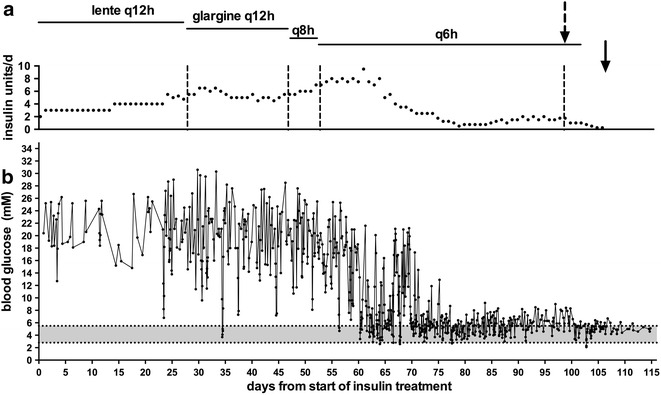
Fig. 1.

Total daily insulin doses (a) and all blood glucose values (b) from commencement of treatment until 1 week after cessation of insulin. The shaded area represents the normal blood glucose range. The broken arrow represents the time that caloric intake was restricted to a maximum of 75 g wet and 25 g dry food (Purina DM) and increased physical activity by encouraging play several times a day. The solid arrow indicates the time when insulin was ceased
