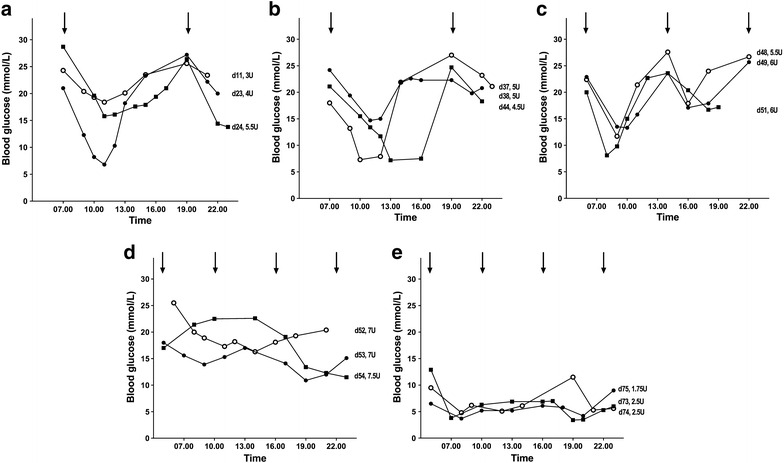
Fig. 2.

Daily blood glucose profiles on porcine lente insulin 12-hourly (a) and glargine 12-hourly (b), 8-hourly (c) and 6-hourly (d, e). Times of insulin administration are indicated by the arrows. The day from the start of insulin treatment and total daily units (U) of insulin are indicated to the right of each profile
