Fig. 3.

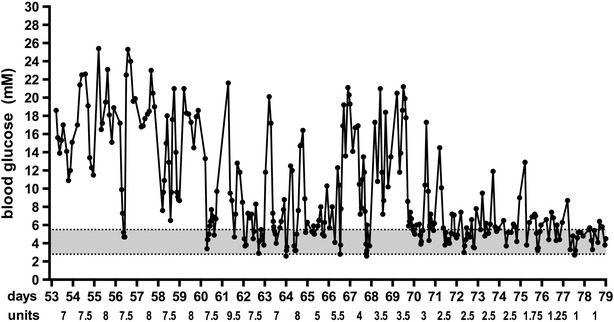
All blood glucose values from day 53 to day 79 of treatment. The shaded area represents the normal blood glucose range. The total daily glargine dose, that was divided and delivered 6-hourly, is shown

All blood glucose values from day 53 to day 79 of treatment. The shaded area represents the normal blood glucose range. The total daily glargine dose, that was divided and delivered 6-hourly, is shown