Fig. 4.

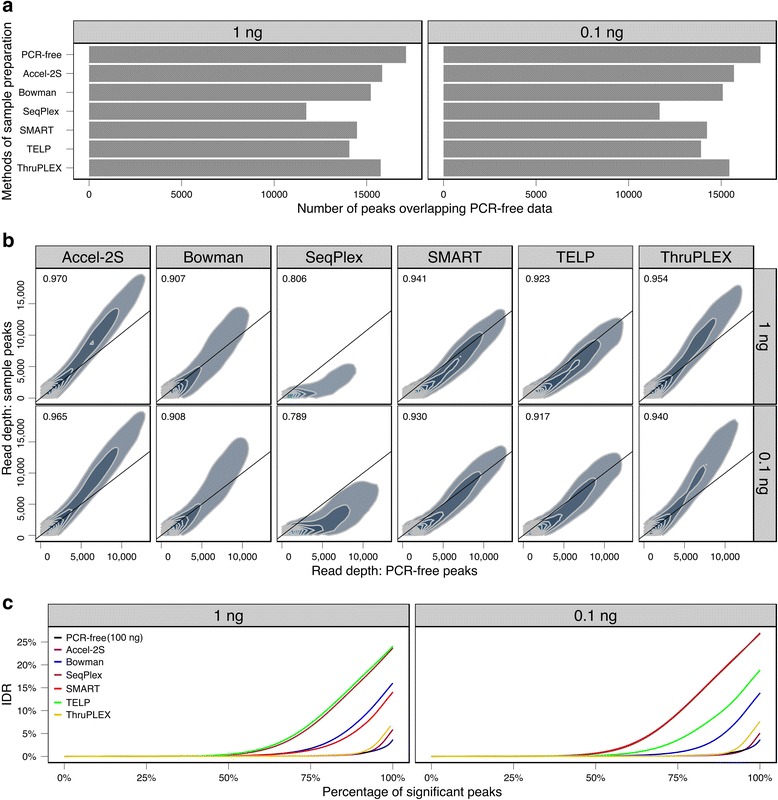
Correlation of peak calling and reproducibility of datasets. a Number of overlapping peaks found in all 5 replicates for the 1 ng and 0.1 ng input methods, and all three PCR-free replicates. b 2d density estimation of number of read bases within PCR-free peaks (present in all three replicates) against the number of reads bases within the same regions for all replicates of other methods. Data calculated using 5.5 million uniquely mapping non-duplicate reads for all methods, with 1 ng and 0.1 ng input level. Only reads mapping to peaks found in the PCR-free datasets were analyzed and included in correlation calculations. Spearman correlation coefficients for each method are given. Black line represents slope 1 and is provided for reference. c Irreproducible discovery rate (IDR) at different numbers of selected peaks, plotted at various IDR cutoffs for all methods. IDR for PCR-free (100 ng) method is shown in both 1 ng and 0.1 ng input panels for illustration
