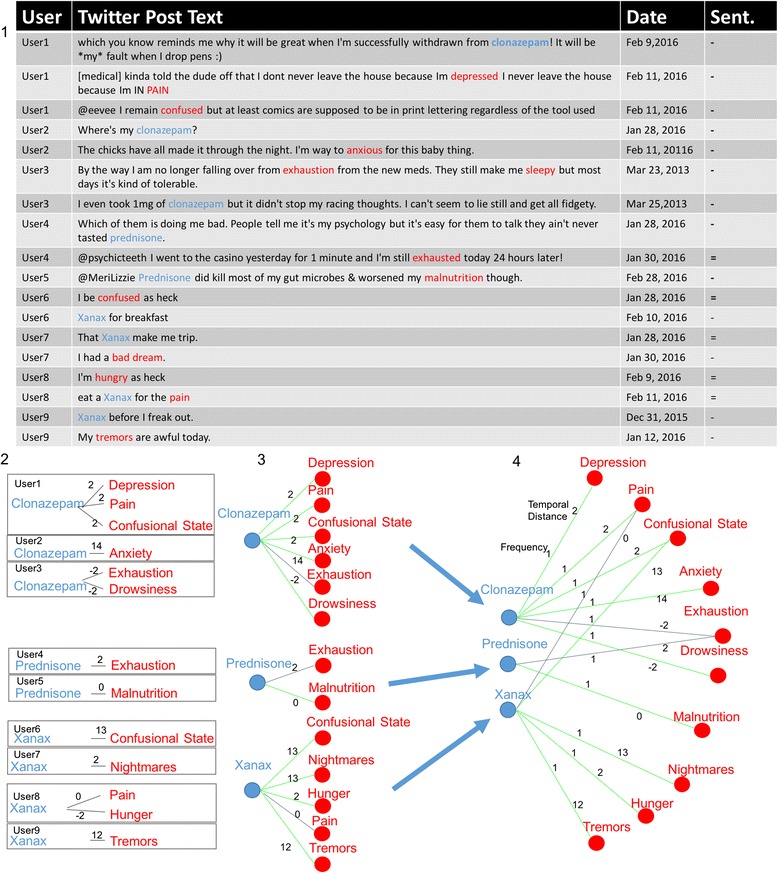
Fig. 3.

Illustration of DEGTwitter construction. DEGTwitter is constructed from the drugs and side effects mentions in user tweet histories. 1. 18 example tweets from 9 individual users from our dataset (after experiential tweet filtering and entity extraction). The table includes anonymized usernames, tweet text (nominally altered/censored where appropriate), date the tweet was posted, and the computed sentiment. Drug entities extracted from the text are highlighted in blue and effects in red. 2. Individual user histories are used to construct a set of DEGUser graphs. User graphs contain all entities identified in a user history that were posted within a specified distance of an entity of the opposite class (20 days in this case). A drug and a side effect have a connecting edge if they were mentioned within the window. Edges are weighted by temporal distance (in days). 3. Edges are labeled according to the SIDER database as either adverse (green) or pseudo-non-adverse (grey). 4. Edges are aggregated across all graphs forming the DEGTwitter which contains all nodes and edges found in DEGuser graphs, temporal distance edge weights are averaged if two DEGUser graphs contained the same edge. An additional edge weight reflects the number of DEGuser graphs that contain the edge
