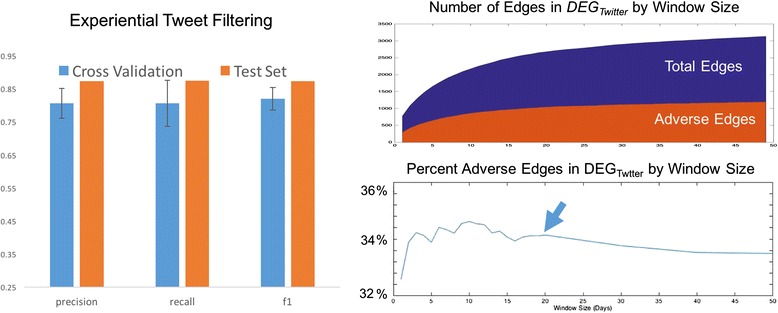
Fig. 5.

Tweet filtering and DEGTwitter construction characteristics. Left, Performance evaluation results for experiential tweet filtering. Blue shows average 10-fold cross-validated results on the training set with error bars indicating one standard deviation above and below the mean. Orange is the result on the test set. Right, top shows growth rate of DEGTwitter as the window size, t, increases (x axis). Y axis is number of edges. The number of adverse edges is shown in orange. Right, bottom shows the percentage of total edges that are adverse. The arrow indicates t = 20 where this value stabilizes and begins to slowly decline
