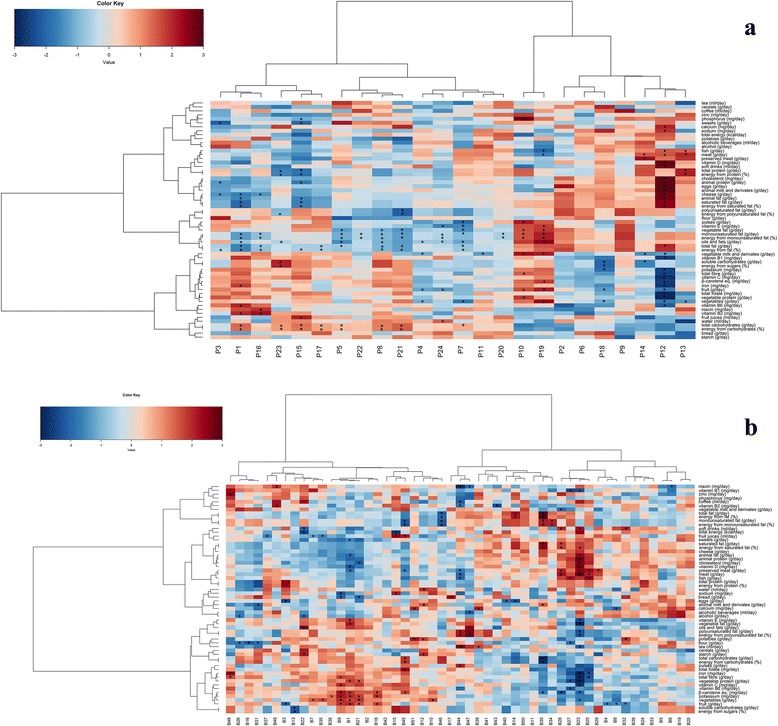
Fig. 2.

Correlation patterns between oligotypes and diet. Correlation between Prevotella (a) and Bacteroides (b) oligotypes and dietary data. Heatplot showing Spearman’s correlations between oligotypes and dietary data. Rows and columns are clustered by Euclidean distance and Ward linkage hierarchical clustering. The intensity of the colours represents the degree of association between oligotypes and foods/nutrients as measured by Spearman’s correlations. Asterisks denote significant correlations after P value corrections (P < 0.05)
