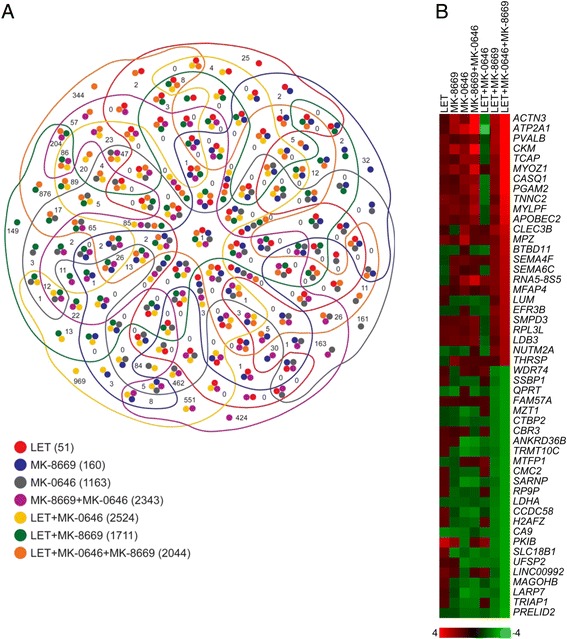
Fig. 6.

RNAseq analysis reveals both overlapping and non-overlapping gene expression patterns in MCF-7/AC-1 xenografts. a Venn Diagram of the overlapping and unique number of genes according to treatment cohort(s). b Heatmap depicting the most significantly up (red) and down (green) regulated genes in LET + MK-8669 + MK-0646-treated tumors compared to the remaining treatment cohorts. Color bar indicates log-fold expression change compared to control tumors
