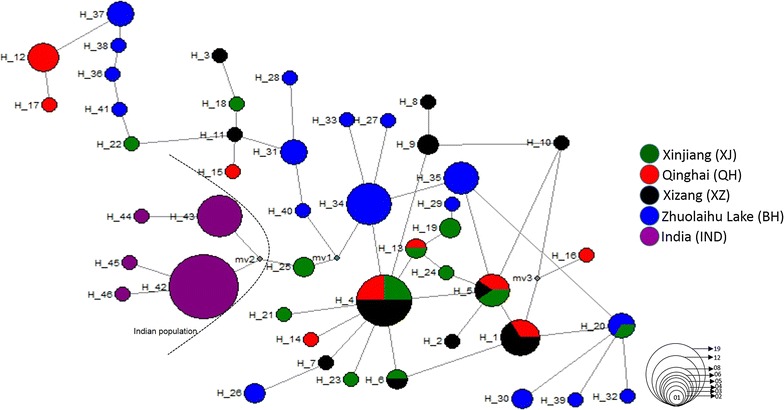
Fig. 4.

Median-joining networks showing genetic relationship among control region haplotypes of Pantholops hodgsonii (n = 118). Each circle represents a haplotype and its size is proportional to its total number of individual sequences. Gray dots indicate median vectors; circle colour denotes sampling location of different population
