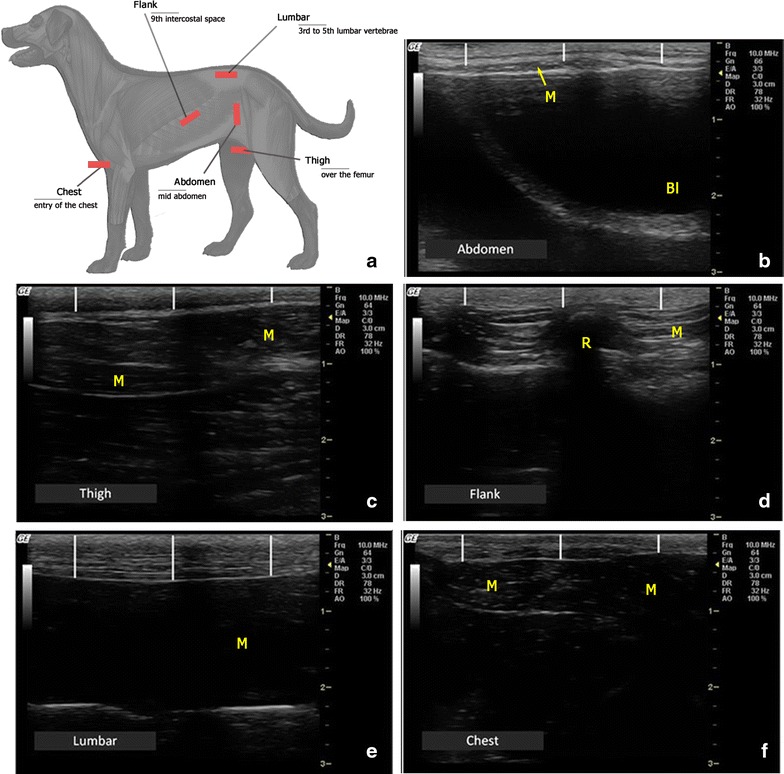
Fig. 1.

Real-time ultrasonography (RTU) assessment of subcutaneous fat thickness (SFT) in dogs. a Schematic representation of the anatomical sites used in the study to assess SFT in dogs. The red box illustrates the transducer location in each of the five areas used in the study. b–f Representative RTU images from the five anatomical areas sampled. In each image, measurements of subcutaneous fat thickness (SFT) were taken at three different locations (white vertical lines) to estimate a mean SFT value. M muscle plan, B bladder, R ribs’ acoustic shadow
