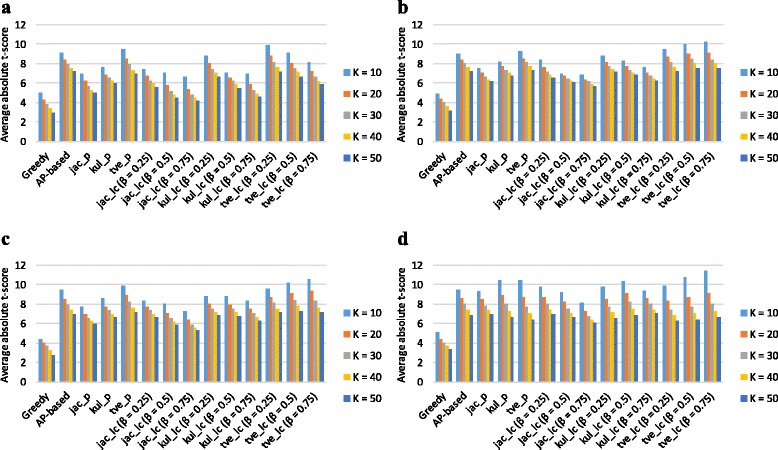
Fig. 1.

Discriminative power of subnetwork markers identified on GSE2034 by different methods. We computed the average absolute t-test score of the top K=10, 20, 30, 40, and 50 subnetwork markers identified on GSE2034 by various methods for the following PPI datasets: a Chuang, b HPRD, c GASOLINE, and d BioGRID
