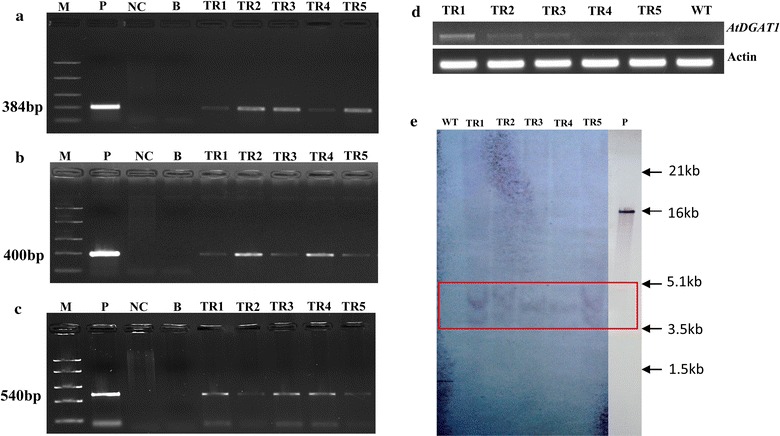
Fig. 2.

Molecular analysis of transgenic plants of Jatropha curcas. a PCR amplification of the 384-bp fragment of AtDGAT gene; b PCR amplification of the 400-bp fragment of gus gene; c PCR amplification of the 540-bp fragment of nptII gene. Lane M molecular marker, Lane TR1, TR2, TR3, TR4, TR5, genomic DNA from five transgenic plant Lane P, pBI121::AtDGAT1 plasmid (positive control), Lane NC, DNA from untransformed plant (negative control) and Lane B, blank; d Transcript abundance of AtDGAT1 in transgenic line of J. curcas. Expression analysis was carried out by semi-quantitative PCR using actin as an internal control. e Southern blot analysis of transgenic plants expressing AtDGAT1,the plasmid and 60 µg genomic DNA was digested with BamHI, and hybridized with PCR-amplified nptII probe, lane WT genomic DNA from untransformed plant, Lane TR1–TR5 genomic DNA from transgenic lines, Lane P BamHI digested pBI121::AtDGAT1 plasmid
