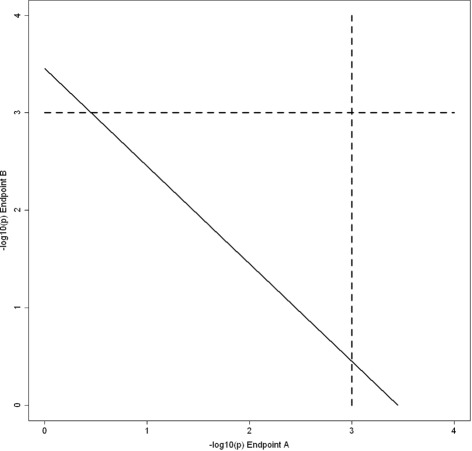
Fig. 1.

Rejection Regions of PROMISE and List Overlap Methods. The figure illustrates the rejection regions defined by PROMISE and list overlap methods for association of one genomic variable with two endpoint variables. The horizontal axis shows −log10(p) for association of the genomic variable with one endpoint (Endpoint A) and the vertical axis shows −log10(p) for association of the genomic variable with the other endpoint (Endpoint B). The dashed lines at 3 indicate the significance thresholds for −log10(p) obtained by using p=0.001 as the threshold to declare significance for association of one genomic variable with one endpoint. Thus, the list overlap method will only identify genomic variables with −log10(p) in the top right corner. In contrast, PROMISE will identify genomic variables above and to the right of a diagonal line as significant. The position of the PROMISE threshold line will vary from application to application, but will usually encapsulate the overlap region
