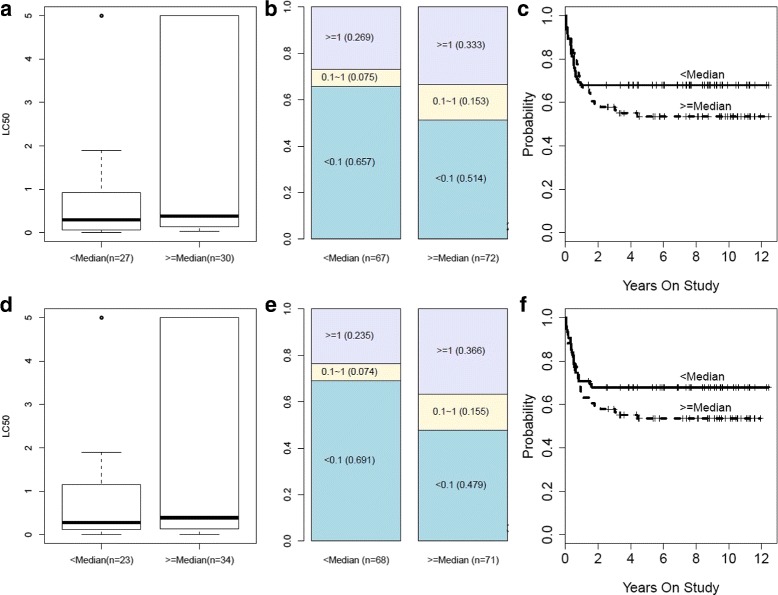
Fig. 4.

Detailed Endpoint Association Results for HOXB6 in the AML Study. Panel a shows a boxplot of LC50 values according to dichotomization of the CC expression scores by the median (low or high). Panel b shows the prevalence of undetectable MRD, low MRD, and high MRD according to the dichotomized CC expression score. Panel c shows EFS according to the dichotomized CC expression score. Panels d, e, f provide analogous results according to median-dichotomization of the CC methylation score
