
Figure 6.
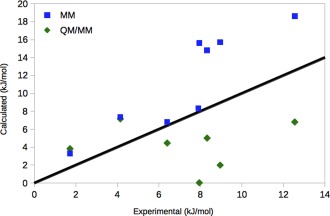
Comparison of the MM and SQM/MM (ssEAc) results for NOA, compared to the experimental relative affinities44 for the eight considered transformations. The black line shows the perfect correlation. [Color figure can be viewed in the online issue, which is available at wileyonlinelibrary.com.]