
Figure 1.
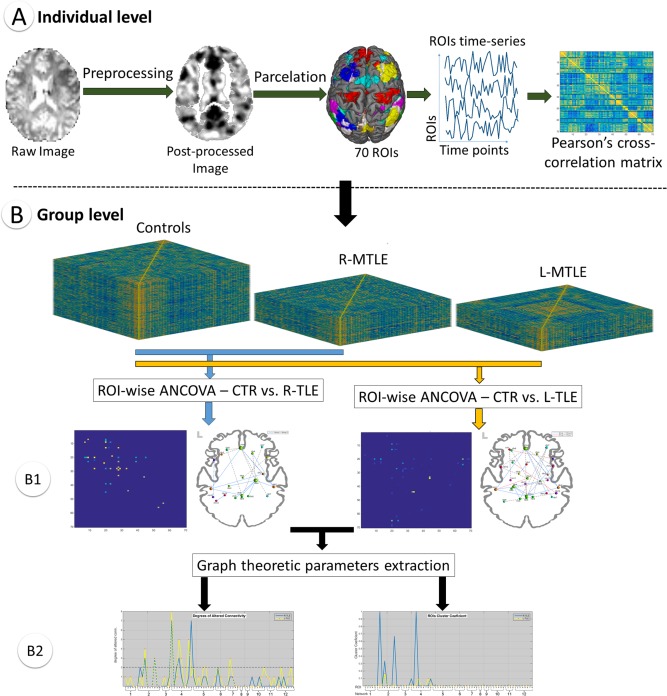
Pre‐ and post‐processing flowchart for first and second statistical levels. The part “A” describes all individual steps included in the first level statistical analysis. The part “B” describes the group level statistical and graph‐theory analysis. ROIs: regions of interest; R‐MTLE: right mesial temporal lobe epilepsy; L‐MTLE: left mesial temporal lobe epilepsy; CTR: control group.