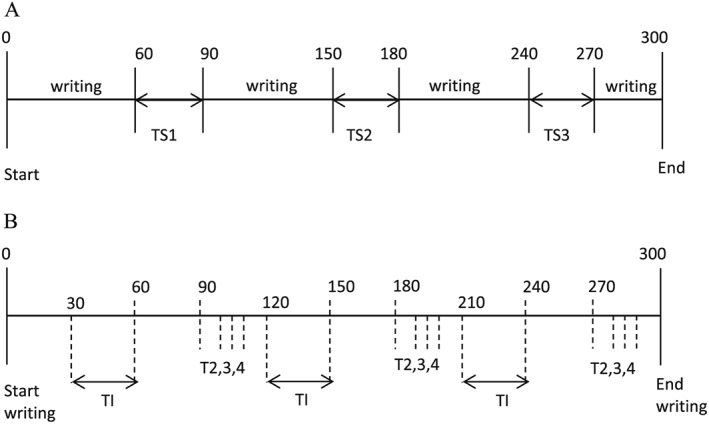
Figure 1.

The figure displays the timeline for the experimental conditions, starting at 0 s and ending at 300 s. In conditions with background sound, the sound was played continuously during the whole period of 300 s. Panel A shows the position (in time) for the three task interruptions (TS1, TS2, TS3: Task Shift Interval 1, 2 and 3 respectively) as they were presented in experimental conditions with task interruptions. In experimental conditions without task interruptions, the participants continued writing during these time intervals. Panel B shows the time intervals where writing speed (characters/s) was measured (T1: the last 30 s before interruption; T2, 3, 4: the first 10 s after the interruption, the next 5 s after and the next 5 s after that, respectively). Note that the time intervals, at which point writing speed was measured, were the same for all conditions (for those with and those without interruptions, and for those with and those without background sound)
