Abstract
Background and Objective
Molecules native to tissue that fluoresce upon light excitation can serve as reporters of cellular activity and protein structure. In skin, the fluorescence ascribed to tryptophan is a marker of cellular proliferation, whereas the fluorescence ascribed to cross‐links of collagen is a structural marker. In this work, we introduce and demonstrate a simple but robust optical method to image the functional process of epithelialization and the exposed dermal collagen in wound healing of human skin in an organ culture model.
Materials and Methods
Non‐closing non‐grafted, partial closing non‐grafted, and grafted wounds were created in ex vivo human skin and kept in culture. A wide‐field UV fluorescence excitation imaging system was used to visualize epithelialization of the exposed dermis and quantitate wound area, closure, and gap. Histology (H&E staining) was also used to evaluate epithelialization.
Results
The endogenous fluorescence excitation of cross‐links of collagen at 335 nm clearly shows the dermis missing epithelium, while the endogenous fluorescence excitation of tryptophan at 295 nm shows keratinocytes in higher proliferating state. The size of the non‐closing wound was 11.4 ± 1.8 mm and remained constant during the observation period, while the partial‐close wound reached 65.5 ± 4.9% closure by day 16. Evaluations of wound gaps using fluorescence excitation images and histology images are in agreement.
Conclusions
We have established a fluorescence imaging method for studying epithelialization processes, evaluating keratinocyte proliferation, and quantitating closure during wound healing of skin in an organ culture model: the dermal fluorescence of pepsin‐digestible collagen cross‐links can be used to quantitate wound size, closure extents, and gaps; and, the epidermal fluorescence ascribed to tryptophan can be used to monitor and quantitate functional states of epithelialization. UV fluorescence excitation imaging has the potential to become a valuable tool for research, diagnostic and educational purposes on evaluating the healing of wounds. Lasers Surg. Med. 48:678–685, 2016. © 2016 The Authors. Lasers in Surgery and Medicine Published by Wiley Periodicals, Inc.
Keywords: autofluorescence, imaging, skin, wound healing, UV, epithelialization, collagen
INTRODUCTION
Chronic wounds are estimated to affect 6.5 million people in the United States at a cost of $25 billion per year 1. Improved technologies and strategies for wound management are needed to ease this social and economic burden. Measurements of whole wounds have the potential to offer clinicians and researchers additional information for diagnostic, research, and educational purposes. The most basic and yet powerful tool in wound clinic is still visual observation, which requires an experienced observer. Accumulation of experience may take years and is still subjective. There are useful methods for recording an image of the wound that allow post‐visitation analysis, such as ruler‐based measurements 2, 3, computerized planimetry 4, and digital image analysis 5, 6. Calibration of color and the difficulty of identifying wound edges limit these methods, especially for complex wounds. Newer technologies for wound imaging comprise three‐dimensional laser imaging 7, optical coherence tomography 8, and two‐dimensional imaging of Ph and partial pressure of oxygen 9. These useful and complex techniques have not been evaluated sufficiently—on the required clinimetric properties, reliability, validity, and feasibility—and are expensive and difficult to use. Quantitative, objective, and simple measurement methods are still in development 1.
Fluorescence excitation of endogenous or native tissue molecules provides the ability to examine specific functional and structural states of the tissue. In skin, the endogenous molecules that exhibit fluorescence, or fluorophores, upon excitation with ultraviolet (UV) light include aromatic amino acids, such as tryptophan and tyrosine, and structural proteins, such as collagen and elastin. Additional fluorophores, which become excited at visible and infrared wavelengths, include nicotinamide adenine dinucleotide, porphyrins, and flavins 10, 11. Numerous studies and a recent review of the applications of fluorescence excitation spectroscopy to dermatology established the excitation/emission pair at 295/340 nm wavelengths ascribed to tryptophan moieties as a marker for epidermal proliferation 12, 13, and the pair at 335/390 nm ascribed to pepsin‐digestible cross‐links of collagen as a marker for aging and photoaging 12, 14, 15. A UV Fluorescence Excitation Photography System for visualization of cellular proliferation was recently proven to clearly capture the fluorescence of rapidly proliferating epidermal skin lesions, such as psoriasis, actinic keratosis and basal cell carcinoma 16.
In this work, we introduce and demonstrate a simple but robust optical method to image cellular epithelialization by fluorescence excitation of tryptophan and the exposed dermal collagen by fluorescence excitation of pepsin‐digestible collagen cross‐links, during wound healing of human skin in organ culture. As application examples, we consider three different wounds scenarios generated by manipulating culture media and intervention type; namely, non‐closing non‐grafted (cultured in saline), partial closing non‐grafted (cultured in DMEM), and fully closing grafted wounds (cultured in DMEM). The significance of these scenarios is to model relevant clinical settings, such as non‐responding chronic wounds, slowly healing chronic wounds, and wounds with grafting interventions. Wound measurements from fluorescence images are used to evaluate closure or re‐epithelialization.
STUDY DESIGN AND METHODS
Non‐Closing and Partial Closing Superficial Wounds: Organ Culture Model
Human skin was obtained following a protocol approved by Massachusetts General Hospital for skin discarded by abdominoplasty surgery. Tissue was disinfected with Iodine, washed three times with saline, and submerged for 20 minutes in saline with 1% Anti–Anti (Gibco, Grand Island, NY). Circular full‐thickness specimens of skin were cut with a 12 mm biopsy punch. Subcutaneous fat was carefully removed from the specimens with sterile scissors. Superficial wounds of 4 mm diameter were created at the center of each skin specimen with a punch biopsy cutting only through the epidermis and upper dermis, which were excised with forceps and a sterile blade, see Figure 1. The depth of wounds was 300–500 μm. Each skin specimen was placed inside a nylon‐meshed cell strainer (BD Biosciences, San Jose, CA) with the epidermis facing up. Cell strainers containing the skin were placed into six‐well plates. A 5 ml of DMEM (Gibco, Grand Island, NY) with 10% FBS (Gibco), and 1% Anti–Anti (Gibco) were added to each plate. Full‐thickness, wounded skin specimens were cultured maintaining its surface at the liquid‐air interphase inside a cell incubator at 37°C and 5% CO2. Non‐closing wounds were cultured in saline solution, subjected to deficiency in nutrition. Media was changed every 2 days. Skin tissue from three different abdominoplasty surgeries was used to prepare eight samples per tissue. For each independent skin tissue (n = 3), one sample for histology was collected at days 0, 4, 8, and 12, and the remaining four samples were used in day 16. All the wounds reported in this manuscript were prepared and put in culture within 5 hours or less of the surgical excision.
Figure 1.
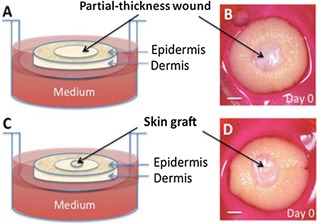
(A, B) Non‐grafted wound: dermal wounds of 4 mm diameter were created at the center of a 12 mm skin specimen with a punch biopsy cutting only through the epidermis and upper dermis. (C, D) Grafted wound: a thru hole was pierced at the center of the wound with a sterile 15‐gauge needle, and a 1 mm diameter full‐thickness skin biopsy (black arrows) was grafted into this hole. Scale bar is 2 mm.
Fully Closing Grafted Wounds: Organ Culture Model
Skin specimens (n = 12) and 5 mm diameter wounds were prepared as described above. Next, a thru hole was pierced at the center of each wound with a sterile 15‐gauge needle of 1.37 mm inner diameter. A 1 mm full‐thickness skin biopsy was transplanted into this hole as illustrated in Figure 1C and D. Skin grafted specimens were cultured for 28 days in DMEM with 10% FBS and 1% Anti–Anti with EGF (2 ng/ml, Thermo Fisher Scientific). Culture conditions were the same as those described above. For histology evaluation, two independent samples were collected from different specimens in weeks 1, 2, and 3; the last set of samples was collected in week four from the remaining specimens.
Histology Evaluation
Harvested specimens were fixed in 10% formalin, dehydrated using an ethanol–xylene series, bisected, and embedded in paraffin. Tissue samples of 5 μm in thickness were consecutively cut until the wound was microscopically visible and, subsequently, stained with standard hematoxylin and eosin. Slides were digitized using a whole‐slide scanner instrument (Nanozoomer, Hamamatsu, Japan).
UV Fluorescence Excitation Imaging
We recently developed an ultraviolet fluorescence excitation imaging (u‐FEI) system that exploits the fluorescence of molecules native to skin 17. Briefly, the system utilizes a Xenon arc lamp and a series of narrow‐band radiation filters to illuminate the tissue at specific excitation wavelengths, and a series of narrow‐band collection filters and a UV‐sensitive camera to capture images at specific emission wavelengths as illustrated in Figure 2. For this study, the u‐FEI system was used to acquire images at excitation/emission wavelengths of 295/340 nm and 335/390 nm. The fluorescence from the 295/340 nm band is ascribed to tryptophan. Variations in the fluorescence intensity of this band correspond to changes in cellular proliferation. The fluorescence from the 335/390 nm band is ascribed to pepsin‐digestible cross‐links of collagen 16. Images of skin wounds were analyzed in Matlab using an algorithm for statistical image processing. Standard color images were acquired using a Nikon D80. The bandwidths of the 295, 340, 335, and 390 nm filters are 27, 12, 7, and 40 nm, respectively.
Figure 2.
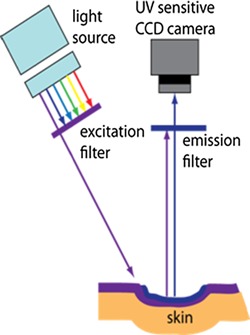
UV Fluorescence Excitation Imaging: sample is excited at specific wavelengths (295 or 335 nm) while a UV sensitive camera images the emission at the corresponding fluorescence wavelengths (340 or 390 nm).
Quantitation of Wound Parameters
Wound area was calculated from the florescence excitation images at 335 nm by pixel counting and a reference scale factor: 1 pixel = 0.068 mm. Wound closure extent was calculated as the ratio of the difference between initial and current area (A c) to the initial area (A i); that is, (A i − A c)/A i.
Wound gap is defined as the distance from one wound edge to the other along the bisection line. Wound gaps obtained from fluorescence excitation images were compared to those measured on histology slides, which were the widest from the histology deck of consecutive vertical cuts. Briefly, specimens were bisected along the major axis of the wound; next, the resulting halves were embedded in paraffin, and three consecutive cross‐sections of 5 μm thickness were collected from the visible wound side to create slides; commercial hardware and software (Nanozoomer, Hamamatsu, Japan) were used to digitize the slides and measure gaps. In a similar way, gaps were measured along the same bisecting line in the fluorescence images.
Statistical Analysis
Analysis of variance (two‐way ANOVA) and student t‐test were used to compare groups, namely interventions to generate different healing conditions and methods to quantify gaps; values were considered significant when P < 0.05.
RESULTS
We refer to the 4 mm diameter partial‐thickness wounds cultured in saline as non‐closing wounds, Figure 3A–C, and to those cultured in DMEM as partial closing wounds, Figure 3D–F.
Figure 3.
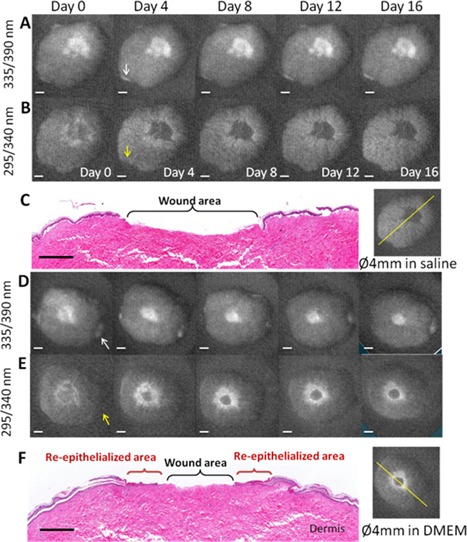
Fluorescence excitation images of a 4 mm diameter non‐grafted wound cultured in saline solution at different days: (A) cross‐links of collagen, and (B) cellular proliferation (scale bar = 2 mm). (C) H&E stained skin (histology scale bar = 1 mm) from day 16 and the corresponding fluorescence image illustrating the line of the histology cut. Fluorescence excitation images of a 4 mm diameter non‐grafted wound cultured in DMEM at different days: (D) cross‐links of collagen, and (E) cellular proliferation (scale bar = 2 mm). (F) H&E stained skin histology (scale bar = 1 mm) from day 16 and the corresponding fluorescence image illustrating the line of the histology cut. Upon excitation at 335 nm, the fluorescence at 390 nm of pepsin‐digestible cross‐links of collagen clearly shows the exposed dermis. The intensity and surface distribution (shape) of the fluorescence from the wound in nutrition deficiency remained the same from days 0 to 16 (non‐closing wound), while the surface distribution of the wounds in DMEM decreased in size and their intensity remained the same. Upon excitation at 295 nm, the fluorescence of cellular proliferation at 340 nm delineated the wound margin of these non‐grafted wounds at day 0. This margin displayed an initial width (surface distribution) that diminished and faded away in the wound in nutrition deficiency by day 16, while it increased in width and intensity in the wound in DMEM. Arrows indicate exposed dermis from the tissue edge, not from the wound.
Fluorescence Excitation Imaging of Cross‐Links of Collagen
Upon excitation at 335 nm, the fluorescence of pepsin‐digestible cross‐links of collagen clearly shows the exposed dermis. Day 0 images, A and D in Figure 3, show the initial size and shape of the wound. The intensity and surface distribution (shape) of the fluorescence from the non‐closing wound remained the same from day 0 to 16, Figure 3A. For the same observation period, the surface distribution of the fluorescence from the partial‐closing wound decreased in size but the intensity remained the same, Figure 3D. Figure 4 shows the wound gap as a function of time for non‐closing and closing wounds and for measurements obtained from fluorescence images and histology. In time, the wound gap of the non‐closing wound remains the same, as expected; while the wound gap of partial closing wound decreased to 2.2 ± 0.1 mm by day 16. Error bars denote the standard deviation of the mean of three independent samples (different skin donor). Figure 4 also shows good agreement between the gap measurements obtained by fluorescence excitation imaging and histology evaluation. Grafted wounds also displayed fluorescence at 335 nm excitation wavelength where the dermis was exposed.
Figure 4.
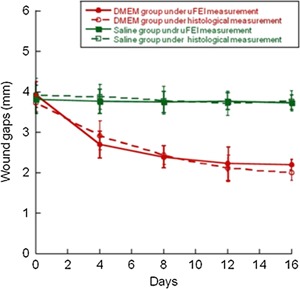
Wound gaps as a function of time for non‐closing and partial closing wounds: solid lines denote measurements obtained from fluorescence images, and dashed lines denote measurements obtained from histology images. ANOVA between saline and DMEM groups shows statistical difference (P < 0.01), between histology and fluorescence there is no difference.
Fluorescence Excitation Imaging of Keratinocyte Proliferation
Upon excitation at 295 nm, the fluorescence of cellular proliferation delineated the wound margin of the non‐grafted wounds at day 0. This margin displayed an initial width (surface distribution) that diminished and faded away in the non‐closing wound by day 16, Figure 3B, while it increased in width and intensity in the partial closing wound but appeared to stall by day 12, Figure 3E. The grafted wound displayed weak fluorescence at day 0, Figure 5C, eventually the intensity of fluorescence increased following similar spatial dynamics as in those of the partial closing wound but providing complete coverage by day 28, Figure 5D. The original epidermis of the grafted skin never displayed increased fluorescence. The intensity of fluorescence only increased around it.
Figure 5.
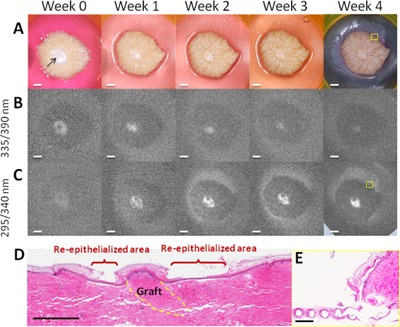
Wound grafted with a 1 mm skin biopsy (arrow): (A) color images and fluorescence excitation images of (B) cross‐links of collagen and (C) cellular proliferation at different time points; scale bar = 2 mm. (D) H&E stained skin histology from week 4; scale bar = 1 mm. (E) Histology showing newly formed epithelium on the mesh from the edge of the skin; yellow boxes in week 4 of (A) and (C) denote the location of histology; scale bar = 0.25 mm. Grafted wounds displayed fluorescence at 390 nm upon excitation at 335 nm where the dermis was exposed or not grafted; the size and intensity of fluorescence area were decreased as the dermis was covered from day 0 to week 4. Upon excitation at 295 nm, the intensity and extent of fluorescence at 340 nm increased from the margin of the wound and the graft, as new epithelium was formed. The original epidermis of the grafted skin never displayed increased fluorescence, which only increased around the graft. A flat epithelium with thin stratum corneum was formed between the wound margin and graft perimeter; it fully covered the wound by week 4 as shown by histology.
Quantitative and Longitudinal Tracking of Wound Re‐Epithelialization
Partial closing wounds had closure extents of 48.1 ± 8.0% at day 4 and 65.5 ± 4.9% at day 16 (P < 0.01), Figure 6. As expected, the exposed surface area, approximately 11 mm2, of the non‐closing wound remained the same, Figure 6. ANOVA between groups shows statistical difference (P < 0.01). This figure exemplifies the metrics that can be readily obtained to inform the clinician about the progress of healing.
Figure 6.
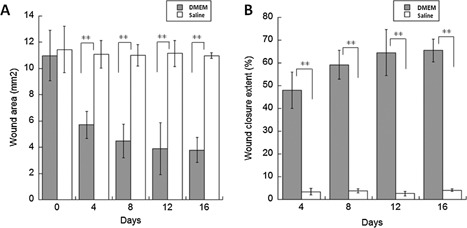
(A) Wound area and (B) wound closure extent as a function of time for non‐closing wounds cultured in saline and partial closing wounds cultured in DMEM. Student t test between groups shows statistical difference (P < 0.01).
DISCUSSION
Wound healing is a complex process that includes partially overlapping phases of hemostasis, inflammation, proliferation, epithelialization, and remodeling. In wound healing of human skin the primary objective of the tissue is to quickly reestablish barrier function. Re‐epithelialization is the most essential process that specifically demarcates the reconstruction of the stratified squamous epithelium 18, 19. It is used as a defining parameter for success; in the absence of re‐epithelialization a wound cannot be considered healed. Furthermore, epithelialization is impaired in all types of chronic wounds, and failure of epithelial cells to sustain a barrier may contribute to reoccurrence of wounds 20, 21. In partial‐thickness epidermal wounds, re‐epithelialization arises mostly at the wound edges from viable epidermal cells that undergo a series of behavioral changes, including cell migration, proliferation, and differentiation of keratinocytes at the wound margins 22, 23. Migration is the first event, which includes the movement of suprabasal cells followed by a mitotic burst 24, 25. The process of differentiation of the newly formed epidermis begins at a short distance behind the migrating tips, very early before re‐epithelialization of the whole wound has been completed 26, 27.
We used an ex vivo human wound model to monitor the process of wound re‐epithelialization. This model has the advantage of including the architecture, all the structures, and every single cell of the skin. Also, it is easy to control and observe 28, 29, 30 and a large number of wounds can be obtained from the same donor minimizing experimental variability. This model is limited by the absence of haemostasis and inflammation processes. Nonetheless, the re‐epithelialization process in this organ culture model is similar to the re‐epithelialization of wounds in in vivo skin: that is, keratinocytes cells migrate, proliferate, and differentiate from the wound edge to cover the entire wound area. The speed of epithelialization is slower than that of healthy skin in vivo, similar to that of slow‐to‐heal wounds in skin compromised by ischemia or diabetes. All things considered, the skin culture model remains a valuable system to study epithelialization, an essential component of wound healing, for which a simple, robust, direct, non‐destructive, and non‐contact method of evaluation of keratinocyte proliferation is highly desirable.
Fluorescence excitation spectra allow identifying excitation wavelengths or bands associated with specific emission bands. Fluorescence excitation spectra indirectly relate to fluorophore absorption spectra, enabling the identification of individual fluorophores in complex biological systems. One advantage of fluorescence excitation spectroscopy over diffuse reflectance is higher sensitivity. If the molecular identity and role of a fluorophore is known, then the molecule has the potential to serve as a fluorescent marker of tissue function or structure. In human skin, the following fluorophores have been identified: tyrosine, 340 nm wavelength emission upon fluorescence excitation at 280 nm wavelength; tryptophan, 345 nm (pH‐dependent) emission upon excitation at 295 nm; pepsin‐digestible collagen cross‐links, 390 nm emission upon excitation at 335 nm; collagenase‐digestible collagen cross‐links, 460 nm emission upon excitation at 370 nm; elastin cross‐links, 530 nm emission upon excitation at 440 nm 12, 14, 31. Numerous studies and a recent review of the applications of fluorescence excitation spectroscopy to dermatology established the fluorescence ascribed to tryptophan moieties as a functional marker for epidermal proliferation, and the fluorescence ascribed to pepsin‐digestible cross‐links of collagen as a structural marker for aging and photoaging 16. Upon this knowledge, we built a fluorescence excitation wide‐field imaging system that excites and image specific fluorophores, thereby eliminating the complexity associated with spectroscopy and, most important, providing an image which is simple to interpret.
In the organ culture model, the fluorescence intensity of the collagen cross‐links clearly shows the exposed dermis, Figure 3A. For the non‐closing wound, the intensity and surface distribution of the fluorescence did not change during the observation period, as nothing was done to alter the concentration of cross‐links. In aging, there is a progressive increase in emission from the 335, 360, and 390 nm excitation bands that correlates with the progressive accumulation of advanced glycation end products, such as cross‐links of collagen and elastin. In collagen gels containing fibroblasts, there is an exponential increase in emission from the 335 nm excitation band that correlates with the exponential increase of the stiffness of the extracellular matrix as the cells remodel their microenvironment 32. For the partial closing wound, the surface distribution of the fluorescence changed while the intensity remained the same, Figure 3D. As the keratinocyte cells covered the exposed dermis the area of cross‐link fluorescence decreased. Therefore, the dermal fluorescence of pepsin‐digestible collagen cross‐links can be used to quantitate wound size, closure extents and gaps, as shown in Figures 4 and 6.
The fluorescence intensity ascribed to tryptophan and cellular proliferation demarcated the perimeter of the wounds at day 0, Figure 3, as a fluorescent ring. For the non‐closing wound, the distribution of fluorescence faded and the ring vanished as the intensity of fluorescence decreased to base line, consistent with an initial epithelialization process at the wound edge that failed to proceed and eventually stopped. On the other hand, for the partial‐closing wound, the intensity and distribution of fluorescence increased as the keratinocyte cells migrated onto the exposed dermis, as corroborated by histology in Figure 3F, whereas keratinocytes behind the migrating front continue to proliferate 33. Tryptophan is an essential amino acid for protein synthesis in every cell; it is known to contribute to the majority of protein fluorescence upon irradiation at 295 nm wavelength 10. Even with excitation below 295 nm, tryptophan dominates most of the emission. Tyrosine and phenylalanine contribute significantly less to the overall emission due to weaker fluorescence yield. Therefore the epidermal fluorescence ascribed to tryptophan can be used to monitor and quantitate functional states of epithelialization.
In the majority of published studies, graft take and epithelialization were evaluated by bedside assessments, by viewing photographic images, and by different observers with diverse opinions and experience, which will inevitably introduce extra bias 34, 35. For the grafted wound in Figure 5A, the fluorescence from the 295 nm excitation band shows complete wound coverage at day 28. Note that there is also fluorescence on the mesh supporting the skin specimen, due to some newly formed epithelium on the mesh. Indeed, histology in Figure 5E shows the newly formed epithelium on the mesh at the edge of the skin specimen—the location of the yellow box in Figure 5D corresponds to histology in Figure 5E. Note also the difficulty in assessing full wound coverage from the color picture, Figures 5A and B. Evidently, our organ culture model is limited as mentioned above and our method must be tested in vivo. However, a UV Fluorescence Excitation Photography System for visualization of cellular proliferation, at the same excitation and emission wavelengths used herein, was recently proven to clearly capture the fluorescence of rapidly proliferating epidermal skin lesions, such as psoriasis, actinic keratosis and basal cell carcinoma 17. This is encouraging, although further ex vivo and in vivo studies are warranted to fully develop and characterize u‐FEI for wound healing.
CONCLUSIONS
In summary, we have established a fluorescence imaging method for studying epithelialization processes, evaluating keratinocyte proliferation, and quantitating closure during wound healing of skin in an organ culture model: the dermal fluorescence of pepsin‐digestible collagen cross‐links can be used to quantitate wound size, closure extents and gaps; and, the epidermal fluorescence ascribed to tryptophan can be used to monitor and quantitate functional states of epithelialization. Our approach is non‐invasive, non‐contact, quick, objective and direct, and relevant to applications and research in tissue engineering, wound healing and dermatology.
ACKNOWLEDGMENTS
Y.W. acknowledges the support from the ASLMS to present at its 35th Annual Conference. E.G. acknowledges the support from UNAM (Universidad Nacional Autónoma de México, PAPIIT TA100215) and the ASLMS to present at its 34th Annual Conference. This work was partially supported by the Army, Navy, NIH, Air Force, VA, and Health Affairs to support the AFIRM II effort, under Award No. W81XWH‐13‐2‐0054. The U.S. Army Medical Research Acquisition Activity, 820 Chandler Street, Fort Detrick MD 21702–5014 is the awarding and administering acquisition office. Opinions, interpretations, conclusions and recommendations are those of the author and are not necessarily endorsed by the Department of Defense.
Conflict of Interest Disclosures: All authors have completed and submitted the ICMJE Form for Disclosure of Potential Conflicts of Interest and none were reported.
REFERENCES
- 1. Dargaville TR, Farrugia BL, Broadbent JA, Pace S, Upton Z, Voelcker NH. Sensors and imaging for wound healing: A review. Biosens Bioelectron 2013; 41:30–42. [DOI] [PubMed] [Google Scholar]
- 2. Langemo DK, Melland H, Hanson D, Olson B, Hunter S, Henly SJ. Two‐dimensional wound measurement: Comparison of 4 techniques. Adv Wound Care 1998; 11:337–343. [PubMed] [Google Scholar]
- 3. Kundin JI. A new way to size up a wound. Am J Nurs 1989; 89:206–207. [PubMed] [Google Scholar]
- 4. Fuller FW, Mansour EH, Engler PE, Shuster B. The use of planimetry for calculating the surface area of a burn wound. J Burn Care Rehabil 1985; 6:47–49. [DOI] [PubMed] [Google Scholar]
- 5. Etris MB, Pribble J, LaBrecque J. Evaluation of two wound measurement methods in a multi‐center, controlled study. Ostomy Wound Manage 1994; 40:44–48. [PubMed] [Google Scholar]
- 6. Hayward PG, Hillman GR, Quast MJ, Robson MC. Surface area measurement of pressure sores using wound molds and computerized imaging. J Am Geriatr Soc 1993; 41:238–240. [DOI] [PubMed] [Google Scholar]
- 7. Smith RB, Rogers B, Tolstykh GP, Walsh NE, Davis MG Jr, Bunegin L, Williams RL. Three‐dimensional laser imaging system for measuring wound geometry. Lasers Surg Med 1998; 23:87–93. [DOI] [PubMed] [Google Scholar]
- 8. Singer AJ, Wang Z, McClain SA, Pan Y. Optical coherence tomography: A noninvasive method to assess wound reepithelialization. Acad Emerg Med 2007; 14:387–391. [DOI] [PubMed] [Google Scholar]
- 9. Meier RJ, Schreml S, Wang X, Landthaler M, Babilas P, Wolfbeis OS. Simultaneous photographing of oxygen and pH in vivo using sensor films. Angew Chem Int Ed Engl 2011; 50:10893–10896. [DOI] [PubMed] [Google Scholar]
- 10. Richards‐Kortum R, Sevick‐Muraca E, Sokolov K, Pavlova I, Follen M. Survey of endogenous biological fluorophores In: Mycek M, Pogue BW, editors. Hand book of biomedical fluorescence. New York: Marcel Dekker, Inc; 2003;237–243. [Google Scholar]
- 11. Zeng H, MacAulay C, McLean D, Palcic B. Spectroscopic and microscopic characteristics of human skin autofluorescence emission. Photochem Photobiol 1995; 61:639–645. [DOI] [PubMed] [Google Scholar]
- 12. Brancaleon L, Lin G, Kollias N. The in vivo fluorescence of tryptophan moieties in human skin increases with UV exposure and is a marker for epidermal proliferation. J Invest Dermatol 1999; 113:977–982. [DOI] [PubMed] [Google Scholar]
- 13. Doukas AG, Soukos NS, Babusis S, Appa Y, Kollias N. Fluorescence excitation spectroscopy for the measurement of epidermal proliferation. Photochem Photobiol 2007; 74:96–102. [DOI] [PubMed] [Google Scholar]
- 14. Kollias N, Gillies R, Moran M, Kochevar I, Anderson RR. Endogenous skin fluorescence includes bands that may serve as quantitative markers of aging and photoaging. J Investig Dermatol 1998; 111:776–780. [DOI] [PubMed] [Google Scholar]
- 15. Franco W, Gutierrez‐Herrera E, Kollias N, Doukas A. Review of applications of fluorescence excitation spectroscopy to dermatology. Br J Dermatol 2016; 174(3):499–504. [DOI] [PubMed] [Google Scholar]
- 16. Gutierrez‐Herrera E, Ortiz AE, Doukas A, Franco W. Fluorescence excitation photography of epidermal cellular proliferation. Br J Dermatol 2016. doi: 10.1111/bjd.14400. [Epub ahead of print]. [DOI] [PubMed] [Google Scholar]
- 17. Franco W, Gutierrez‐Herrera E, Purschke M, Wang Y, Tam J, Anderson RR, Apostolos D. Development of a wide‐field fluorescence imaging system for evaluation of wound re‐epithelialization Spie. Proc SPIE 8565. Photonic Ther Diagn IX 2013;856529. [Google Scholar]
- 18. Martin P. Wound healing—Aiming for perfect skin regeneration. Science 1997; 276:75–81. [DOI] [PubMed] [Google Scholar]
- 19. Eming SA, Martin P, Tomic‐Canic M. Wound repair and regeneration: Mechanisms, signaling, and translation. Sci Transl Med 2014; 6:265. [DOI] [PMC free article] [PubMed] [Google Scholar]
- 20. Yip WL. Influence of oxygen on wound healing. Int Wound J 2015; 12:620–624. [DOI] [PMC free article] [PubMed] [Google Scholar]
- 21. Pastar I, Stojadinovic O, Yin NC, Ramirez H, Nusbaum AG, Sawaya A, Patel SB, Khalid L, Isseroff RR, Tomic‐Canic M. Epithelialization in wound healing: A comprehensive review. Adv Wound Care 2014; 3:445–464. [DOI] [PMC free article] [PubMed] [Google Scholar]
- 22. Palladini RD, Takahashi K, Bravo NS, Coulombe PA. Onset of re‐epithelialization after skin injury correlates with a reorganization of keratin filaments in wound edge keratinocytes: Defining a potential role for keratin 16. J Cell Biol 1996; 1:381–397. [DOI] [PMC free article] [PubMed] [Google Scholar]
- 23. Eisen AZ, Holyoke JB, Lobitz WC. Responses of the superficial portion of the human pilosebaceous apparatus to controlled injury. J Invest Dermatol 1955; 15:145–156. [DOI] [PubMed] [Google Scholar]
- 24. Marks S, Nishikawa T. Active epidermal movement in human skin in vitro. Br J Dermatol 1973; 88:245–248. [DOI] [PubMed] [Google Scholar]
- 25. Garlick JA, Taichman LD. Fate of human keratinocytes during reepithelialization in an organotypic culture model. Lab. Invest 1994; 6:916–924. [PubMed] [Google Scholar]
- 26. Takeo M, Lee W, Ito M. Wound healing and skin regeneration. Cold Spring Harb Perspect Med 2015; 5:a023267. [DOI] [PMC free article] [PubMed] [Google Scholar]
- 27. Moll I, Houdek P, Schäfer S, Nuber U, Moll R. Diversity of desmosomal proteins in regenerating epidermis: Immunohistochemical study using a human skin organ culture model. Arch Dermatol Res 1999; 291:437–446. [DOI] [PubMed] [Google Scholar]
- 28. Kratz G. Modeling of wound healing processes in human skin using tissue culture. Microsc Res Tech 1998; 42:345–350. [DOI] [PubMed] [Google Scholar]
- 29. Lee B, Vouthounis C, Stojadinovic O, Brem H, Im M, Tomic‐Canic M. From an enhanceosome to a repressosome: Molecular antagonism between glucocorticoids and EGF leads to inhibition of wound healing. J Mol Biol 2005; 345:1083–1097. [DOI] [PubMed] [Google Scholar]
- 30. Stojadinovic O, Brem H, Vouthounis C, Lee B, Fallon J, Stallcup M, Merchant A, Galiano RD, Tomic‐Canic M. Molecular pathogenesis of chronic wounds: The role of beta‐catenin and c‐myc in the inhibition of epithelialization and wound healing. Am J Pathol 2005; 167:59–69. [DOI] [PMC free article] [PubMed] [Google Scholar]
- 31. Brancaleon N, Lin G, Kollias N. The in vivo fluorescence of tryptophan moieties in human skin increases with UV exposure and is a marker for epidermal proliferation. J Investig Dermatol 1999; 113:977–982. [DOI] [PubMed] [Google Scholar]
- 32. Padilla‐Martinez JP, Wang R, Franco W. Evaluation of cell and matrix mechanics using fluorescence excitation spectroscopy: Feasibility study in collagen gels containing fibroblasts. Lasers Surg Med 2016. doi: 10.1002/lsm.22501. [Epub ahead of print]. [DOI] [PubMed] [Google Scholar]
- 33. Werner S, Grose R. Regulation of wound healing by growth factors and cytokines. Physiol Rev 2003; 83:835–870. [DOI] [PubMed] [Google Scholar]
- 34. Danielsen P, Jørgensen B, Karlsmark T, Jorgensen LN, Agren MS. Effect of topical autologous platelet‐rich fibrin versus no intervention on epithelialization of donor sites and meshed split‐thickness skin autografts: A randomized clinical trial. Plast Reconstr Surg 2008; 122:1431–1440. [DOI] [PubMed] [Google Scholar]
- 35. Silver GM, Robertson SW, Halerz MM, Conrad P, Supple KG, Gamelli RL. A silver‐coated antimicrobial barrier dressing used postoperatively on meshed autografts: A dressing comparison study. J Burn Care Res 2007; 28:715–719. [DOI] [PubMed] [Google Scholar]


