
Figure 3.
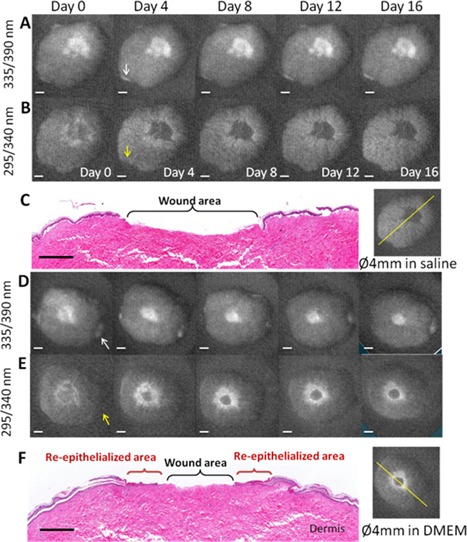
Fluorescence excitation images of a 4 mm diameter non‐grafted wound cultured in saline solution at different days: (A) cross‐links of collagen, and (B) cellular proliferation (scale bar = 2 mm). (C) H&E stained skin (histology scale bar = 1 mm) from day 16 and the corresponding fluorescence image illustrating the line of the histology cut. Fluorescence excitation images of a 4 mm diameter non‐grafted wound cultured in DMEM at different days: (D) cross‐links of collagen, and (E) cellular proliferation (scale bar = 2 mm). (F) H&E stained skin histology (scale bar = 1 mm) from day 16 and the corresponding fluorescence image illustrating the line of the histology cut. Upon excitation at 335 nm, the fluorescence at 390 nm of pepsin‐digestible cross‐links of collagen clearly shows the exposed dermis. The intensity and surface distribution (shape) of the fluorescence from the wound in nutrition deficiency remained the same from days 0 to 16 (non‐closing wound), while the surface distribution of the wounds in DMEM decreased in size and their intensity remained the same. Upon excitation at 295 nm, the fluorescence of cellular proliferation at 340 nm delineated the wound margin of these non‐grafted wounds at day 0. This margin displayed an initial width (surface distribution) that diminished and faded away in the wound in nutrition deficiency by day 16, while it increased in width and intensity in the wound in DMEM. Arrows indicate exposed dermis from the tissue edge, not from the wound.