
Figure 4.
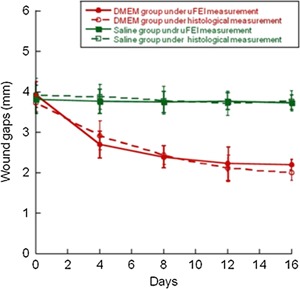
Wound gaps as a function of time for non‐closing and partial closing wounds: solid lines denote measurements obtained from fluorescence images, and dashed lines denote measurements obtained from histology images. ANOVA between saline and DMEM groups shows statistical difference (P < 0.01), between histology and fluorescence there is no difference.