
Figure 5.
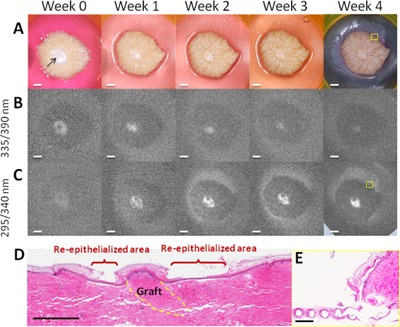
Wound grafted with a 1 mm skin biopsy (arrow): (A) color images and fluorescence excitation images of (B) cross‐links of collagen and (C) cellular proliferation at different time points; scale bar = 2 mm. (D) H&E stained skin histology from week 4; scale bar = 1 mm. (E) Histology showing newly formed epithelium on the mesh from the edge of the skin; yellow boxes in week 4 of (A) and (C) denote the location of histology; scale bar = 0.25 mm. Grafted wounds displayed fluorescence at 390 nm upon excitation at 335 nm where the dermis was exposed or not grafted; the size and intensity of fluorescence area were decreased as the dermis was covered from day 0 to week 4. Upon excitation at 295 nm, the intensity and extent of fluorescence at 340 nm increased from the margin of the wound and the graft, as new epithelium was formed. The original epidermis of the grafted skin never displayed increased fluorescence, which only increased around the graft. A flat epithelium with thin stratum corneum was formed between the wound margin and graft perimeter; it fully covered the wound by week 4 as shown by histology.