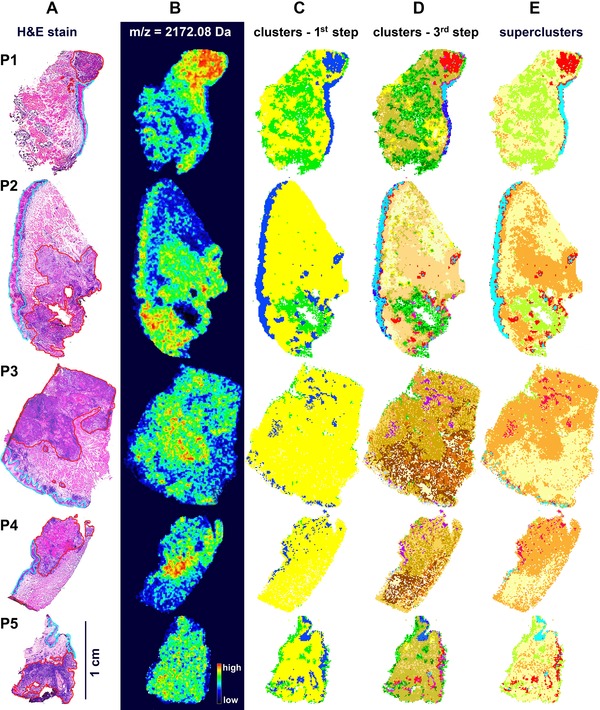
Figure 2.

MALDI‐IMS analysis of oral squamous cell cancer. A – H&E stained tissue preparations; areas corresponding to normal epithelium and tumor were marked with blue and red lines, respectively. B – Distribution of an exemplary component (2172.08 m/z) relatively upregulated in tumor. C – Representation of regions corresponding to clusters A, B and C (navy blue, yellow and green, respectively) detected in the first step of segmentation. D – Representation of regions corresponding to clusters detected in the third step of segmentation. E – Illustration of “superclusters” corresponding to normal epithelium (Normal A, blue) and tumor (Tumor A, red, and Tumor B, orange) regions.
