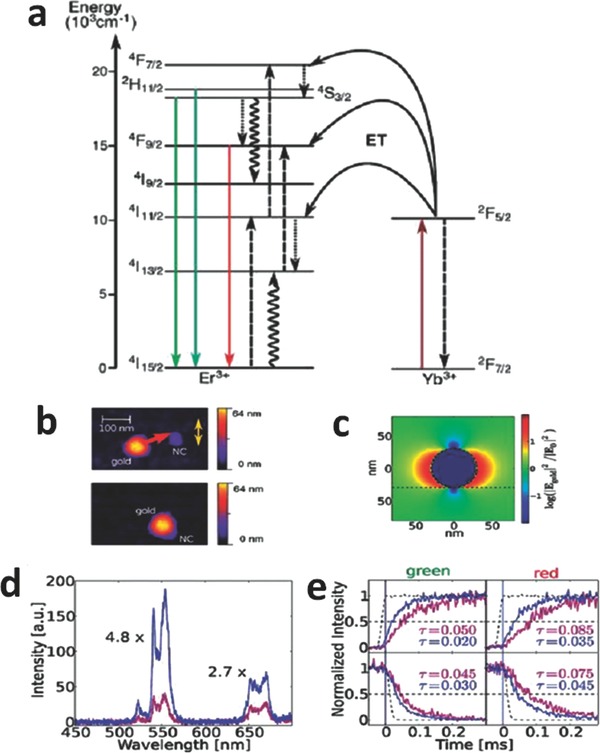
Figure 13.

a) Scheme of energy transfer process in Yb3+/Er3+ co‐doped UCNPs. The energy transfer, radiative, multiphonon, and cross‐relaxation processes are represented by dashed, full, dotted and curly lines, respectively. b) Atomic force microscope (AFM) image of the nanoassembly approach. With the help of the AFM tip, the 60‐nm Au nanosphere is attached to the UCNP. The yellow arrow indicates the polarization axis of the excitation light. c) Finite‐difference time‐domain (FDTD) simulated intensity enhancement of the excitation light around a 60 nm Au nanosphere. d) Upconversion spectra of UCNPs without (violet curve) and with (blue curve) Au nanosphere in close vicinity. e) Rise (upper) and decay times (lower) of the green (left) and red (right) upconversion emission with the same color code in (d). Reproduced with permission.[[qv: 64a]] Copyright 2010, American Chemical Society.
