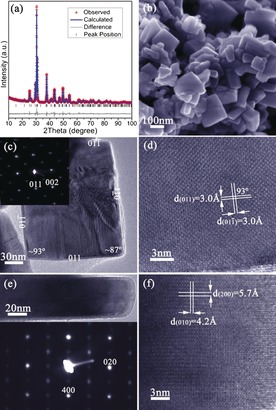
Figure 1.

Characterization of SnSe nanoplates synthesized after 2 h: a) profile plot from Rietveld refinement; b) SEM image; c) TEM image of a SnSe nanoplate and its corresponding SAED pattern along the [100] zone axis; d) HRTEM image of part of the plate shown in (c) with d‐spacings indicated; e) profile HRTEM image of a SnSe nanoplate and its corresponding SAED pattern along the [001] zone axis; and f) HRTEM image of part of the plate shown in (e) with d‐spacings indicated.
