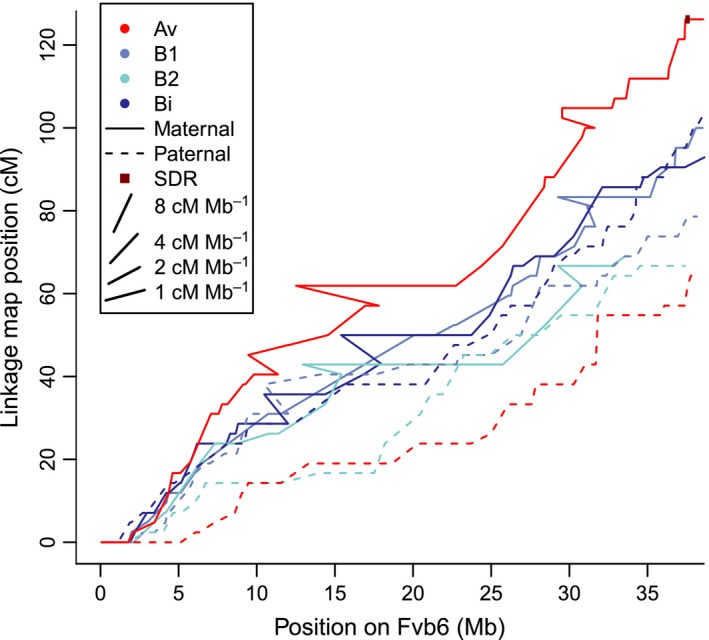
Figure 5.

Recombination events across all eight Fragaria chiloensis VI linkage groups. Markers in each linkage group are plotted with physical Fvb reference genome position on the x‐axis and centimorgan position on the y‐axis. Recombination rates are therefore indicated by the slopes of the lines, as illustrated by the example slopes in the figure legend. Lines are color‐coded based on subgenome, and are solid for maternal linkage groups and dashed for paternal linkage groups. The sex‐determining region (SDR) is shown as a dark red box. For ease of visualization, markers showing radical rearrangements relative to the reference genome (< 5% of all markers) have been removed. The ZW linkage group VI‐Av‐m harboring the SDR has the highest recombination rate across the entire chromosome, while the ZZ linkage group VI‐Av‐p has the lowest recombination rate.
